 Benefits
 Dashboard
Not registered yet? Get a free account.
Sign Up


MAKEMYTRIP (INDIA) LIMITED
www.makemytrip.comLeave site?
You're about to leave our website and go to an external link. Are you sure?
MakeMyTrip (India) Private Limited is a leading online travel agency that provides comprehensive travel services primarily in India. It offers a wide range of products including flight bookings, hotel reservations, holiday packages, and travel insurance, facilitating seamless and convenient travel experiences for both leisure and business travelers.
Makemytrip (India) Limited, also popularly known as MakeMyTrip, is an unlisted public company incorporated on 13 April, 2000. It is classified as a public limited company and is located in Gurugram, Haryana. It's authorized share capital is INR 2,556.76 cr and the total paid-up capital is INR 403.54 cr.
Read more

 Buy Dashboard using Credits
 Buy Dashboard using Credits


- Flight Booking, Hotel Booking
** All rupee values in INR crores. Based on March 2026 numbers.
 20.94%
38.52%
16.8%
39.81%
7.95%
25.07%
2.03
 -0.42
-3.85
6.28
-0.04
 Buy Report or Plans
 Buy Report or Plans

Dashboards
Popular Plan-
₹ 449
 Company dashboard
-
 Five year financials and ratios
-
Risk analysis
-
Interactive charts
-
 Company dashboard

Buy credits

View subscriptions
MCA Fillings
-
₹ 349
All financials
-
All financials
-
All annual returns
-
MoA and AoA
-
-
₹ 249
1 Year
-
Latest financials
-
Latest annual return
-
MoA and AoA
-
PDF Reports
-
₹ 799
Financial report
-
Five year financials and ratios
-
Shareholding and group structure
-
-
₹ 1299
Financial+Litigation report
-
Everything in financial report
-
Litigation report on the company
-
-
₹ 2999
Due diligence report
-
Everything in financial+litigation report
-
Peers and financials
-

* GST not included
** Reports & MCA filings will be based on the latest available financials.
** Delivery timelines are on best-effort basis during working hours. Filings 3-4 hours. Reports 24-48 hours.
 Choose number of credits to buy


₹ 449 + GST
* INR 349 for 20+ credits purchase
1 credit = one company dashboard
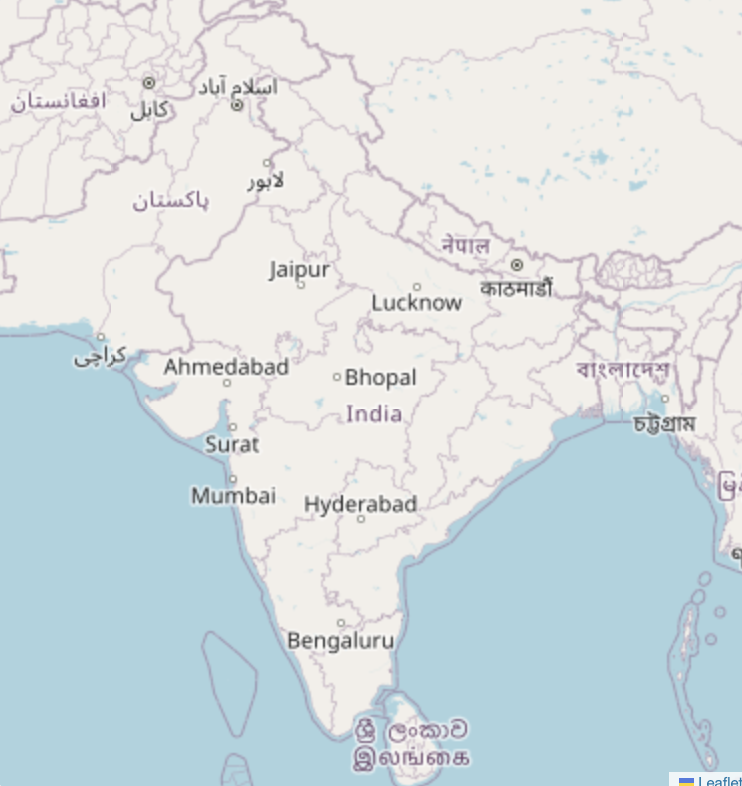
Locations
 India
(30)
| State | Type | Address |
|---|
 Locations on Map
 Locations on Map
 Filter (4)
 Filter (4)
Select Tags
Choose Location
People
| Designation | Name | DIN/PAN | Tenure |
|---|---|---|---|
| Director | Antony Jacob | 00210724 | 0 years |
| Director | Vivek Narayan Gour | 00254383 | 0 years |
| Director | James Varghese Abraham | 02559000 | 0 years |
| Director | Sutapa Banerjee | 02844650 | 0 years |
| Whole-Time Director | Deep Kalra | 00039609 | 0 years |
| Ceo | Rajesh Magow | 00195044 | 0 years |
| Whole-Time Director | Mohit Kabra | 07145238 | 0 years |
| Cfo | Dipak Kumar Bohra | 02854834 | 0 years |
Financial Highlights
| Mar 2022 | Mar 2023 | Mar 2024 | Mar 2025 | Mar 2026 | |
|---|---|---|---|---|---|
| Sales | 1,939.2 | 3,962.5 | 5,231.0 | 6,418.9 | 7,789.5 |
| Operating profit | 9.4 | 194.1 | 596.7 | 920.0 | 1,274.4 |
| Net profit | -26.7 | 64.6 | 1,556.6 | 817.9 | 955.3 |
| Gross margin | 100.0 | 100.0 | 100.0 | 100.0 | 100.0 |
| Operating margin | 0.5 | 4.9 | 11.4 | 14.3 | 16.4 |
| Net margin | -1.3 | 1.6 | 28.8 | 12.4 | 12.0 |
| Networth | 392.5 | 1,015.8 | 2,687.8 | 3,501.9 | 4,896.0 |
| Borrowings | 948.9 | 559.7 | 613.7 | 671.4 | 724.8 |
| Assets | 4,034.8 | 4,963.9 | 7,269.4 | 8,572.2 | 10,721.2 |
| Debt to equity | 2.4 | 0.6 | 0.2 | 0.2 | 0.1 |
| Current ratio | 1.5 | 1.8 | 1.6 | 1.8 | 1.8 |
| ROE | -6.8 | 6.4 | 57.9 | 23.4 | 19.5 |
| Days payable | - | - | - | - | - |
| WC days | 164.0 | 148.0 | 117.0 | 141.0 | 132.0 |

Margins
Balance Sheet
| Mar 2022 | Mar 2023 | Mar 2024 | Mar 2025 | Mar 2026 | |
|---|---|---|---|---|---|
| Equity Capital | 280.0 | 400.9 | 404.1 | 404.1 | 403.5 |
| Reserves | 112.5 | 614.9 | 2,283.6 | 3,097.7 | 4,492.5 |
| Borrowings + | 948.9 | 559.7 | 613.7 | 671.4 | 724.8 |
| Long term borrowings | 501.2 | 554.2 | 605.7 | 660.6 | 692.2 |
| Short term borrowings | 447.7 | 5.5 | 8.0 | 10.8 | 32.6 |
| Trade payables + | 412.3 | 476.4 | 863.4 | 1,081.3 | 1,218.9 |
| Days payable | - | - | - | - | - |
| Other liabilities + | 2,281.1 | 2,911.9 | 3,104.4 | 3,317.6 | 3,881.5 |
| Other non-current liabilities | 1,241.6 | 1,493.7 | 1,081.2 | 1,114.4 | 1,394.0 |
| Other current liabilities | 1,039.5 | 1,418.2 | 2,023.2 | 2,203.2 | 2,487.5 |
| Total liabilities | 4,034.8 | 4,963.9 | 7,269.4 | 8,572.2 | 10,721.2 |
| Fixed Assets + | 1,022.8 | 1,085.8 | 1,061.4 | 1,157.9 | 1,163.2 |
| Tangible assets | 117.7 | 163.2 | 147.6 | 160.4 | 151.7 |
| CWIP | 9.4 | 15.2 | 4.3 | 15.3 | 66.0 |
| Intangible assets | 895.8 | 907.4 | 909.6 | 982.2 | 945.5 |
| LT loans and advances | - | - | 65.0 | 190.0 | - |
| Other non-current assets | 238.8 | 372.7 | 1,566.0 | 1,442.4 | 2,991.7 |
| Current assets + | 2,773.1 | 3,505.3 | 4,576.9 | 5,781.9 | 6,566.3 |
| Inventories | - | - | - | - | - |
| Trade receivables | 410.6 | 714.7 | 1,011.7 | 1,287.0 | 1,113.6 |
| Cash and cash equivalents | 989.4 | 1,498.7 | 1,620.4 | 2,875.5 | 2,739.0 |
| ST loans and advances | 0.4 | 25.4 | 25.2 | 115.0 | - |
| Other current assets | 1,372.7 | 1,266.5 | 1,919.7 | 1,504.4 | 2,713.7 |
| Total assets | 4,034.8 | 4,963.9 | 7,269.4 | 8,572.2 | 10,721.2 |

Total assets
Profit & Loss
| Mar 2022 | Mar 2023 | Mar 2024 | Mar 2025 | Mar 2026 | |
|---|---|---|---|---|---|
| Sales + | 1,939.2 | 3,962.5 | 5,231.0 | 6,418.9 | 7,789.5 |
| Sales growth % | 146.85 | 104.34 | 32.01 | 22.71 | 21.35 |
| Expenses + | 2,074.7 | 3,953.8 | 4,793.6 | 5,669.4 | 6,696.3 |
| Cost of goods | - | - | - | - | - |
| Employee cost | 674.5 | 763.2 | 858.7 | 932.3 | 1,146.0 |
| Other costs | 1,255.4 | 3,005.3 | 3,775.7 | 4,566.7 | 5,369.1 |
| Operating profit + | 9.4 | 194.1 | 596.7 | 920.0 | 1,274.4 |
| Operating margin % | 0.5 | 4.9 | 11.4 | 14.3 | 16.4 |
| Other income | 78.1 | 55.9 | 170.8 | 182.0 | 193.4 |
| Interest | 71.2 | 96.1 | 60.8 | 70.3 | 55.2 |
| Depreciation | 73.6 | 89.3 | 98.4 | 100.1 | 126.0 |
| Exceptional items | - | - | - | - | - |
| Profit before tax | -57.3 | 64.6 | 608.3 | 931.6 | 1,286.6 |
| Tax | -30.6 | - | -948.3 | 113.7 | 331.3 |
| Profit - disc. ops | - | - | - | - | - |
| Net profit | -26.7 | 64.6 | 1,556.6 | 817.9 | 955.3 |
| Net margin % | -1.3 | 1.6 | 28.8 | 12.4 | 12.0 |
Revenue from operations
Ratios
| Mar 2022 | Mar 2023 | Mar 2024 | Mar 2025 | Mar 2026 | |
|---|---|---|---|---|---|
| Solvency + | |||||
| Total Debt/Equity | 2.4 | 0.6 | 0.2 | 0.2 | 0.1 |
| Net Debt/Equity | 0.0 | 0.0 | 0.0 | 0.0 | 0.0 |
| Total Debt/Assets | 0.2 | 0.1 | 0.1 | 0.1 | 0.1 |
| Total Assets/Equity | 10.3 | 4.9 | 2.7 | 2.5 | 2.2 |
| Liquidity + | |||||
| Current Ratio | 1.5 | 1.8 | 1.6 | 1.8 | 1.8 |
| Quick Ratio | 1.5 | 1.8 | 1.6 | 1.8 | 1.8 |
| Interest Coverage | 0.1 | 2.0 | 9.8 | 13.1 | 23.1 |
| Performance | |||||
| Gross Margin | 100.0 | 100.0 | 100.0 | 100.0 | 100.0 |
| Operating Margin | 0.5 | 4.9 | 11.4 | 14.3 | 16.4 |
| Net Margin | -1.3 | 1.6 | 28.8 | 12.4 | 12.0 |
| Return + | |||||
| Return on Equity | -6.8 | 6.4 | 57.9 | 23.4 | 19.5 |
| Pre-tax ROCE | -3.4 | 3.9 | 18.2 | 22.5 | 28.8 |
| Return on Assets | -0.7 | 1.3 | 21.4 | 9.5 | 8.9 |
| Pre-tax ROIC | -16.4 | 10.3 | 18.5 | 23.4 | 23.5 |
| Efficiency + | |||||
| Days Payable | - | - | - | - | - |
| Days Inventory | - | - | - | - | - |
| Days Receivable | 77.0 | 66.0 | 71.0 | 73.0 | 52.0 |
| Fixed Asset Turnover | 1.9 | 3.6 | 4.9 | 5.5 | 6.7 |
| Total Asset Turnover | 0.5 | 0.8 | 0.7 | 0.8 | 0.7 |
| Working Capital | |||||
| Cash Conversion Cycle | 77.0 | 66.0 | 71.0 | 73.0 | 52.0 |
| Working Capital Days | 164.0 | 148.0 | 117.0 | 141.0 | 132.0 |
Ratios
Charges on assets
IndusInd Bank Limited
No. of Loans: 1
Total Amount : 200.0 cr
ICICI Bank Limited
No. of Loans: 218
Total Amount : 195.1 cr
The Hongkong and Shanghai Banking Corporation Limited
No. of Loans: 1
Total Amount : 75.0 cr
DEUTSCHE BANK A.G.
No. of Loans: 1
Total Amount : 75.0 cr
Axis Bank Limited
No. of Loans: 1
Total Amount : 70.0 cr
CitiBank N.A.
No. of Loans: 1
Total Amount : 69.5 cr
HDFC Bank Limited
No. of Loans: 58
Total Amount : 38.4 cr
SBI Cards and Payment Services Ltd.
No. of Loans: 1
Total Amount : 15.0 cr
Standard Chartered Bank
No. of Loans: 1
Total Amount : 2.0 cr


Charges
Company Network

Companies connected through Directors
Subsidiary Companies
| Name | State / Country | Incorporation Year | Paidup Capital |
|---|---|---|---|
| Hotelcloud Services Private Limited | India | - | - |
| QUEST 2 TRAVEL.COM INDIA PRIVATE LIMITED | Maharashtra | 2000 | ₹ 2.4 Cr |
| SAVAARI CAR RENTALS PRIVATE LIMITED | Karnataka | 2012 | ₹ 12.0 Cr |
| BITLA SOFTWARE PRIVATE LIMITED | Karnataka | 2007 | ₹ 1.1 L |
| FLAMINGO TRANSWORLD PRIVATE LIMITED | Gujarat | 1996 | ₹ 88.7 L |
| MakeMyTrip Travel & Tourism L.L.C. | United Arab Emirates | - | - |
| Flamingo Travels Inc. | United States | - | - |
| MakeMyTrip Travel (Thailand) Co., Ltd. | Thailand | - | - |
| MakeMyTrip Travel & Tourism L.L.C | United Arab Emirates | - | - |
Tofler Score

Risk
 Severe Risk
- No risks identified
Moderate Risk
- No risks identified
Low Risk
- No risks identified
About Tofler Score
Read more
Registered Details
CIN
U63040HR2000PLC090846Incorporation
2000, 26.6 yearsCompany Email
compliance@go-mmt.comPaid up Capital
₹ 403.5 CrAuthorised Capital
₹ 2,556.8 CrAGM
Aug 2026Type
FAQ - MAKEMYTRIP (INDIA) LIMITED
What is the incorporation date of MAKEMYTRIP (INDIA) LIMITED?

The incorporation date of MAKEMYTRIP (INDIA) LIMITED is 13 April, 2000
What is the authorized share capital of MAKEMYTRIP (INDIA) LIMITED?
The authorized share capital of MAKEMYTRIP (INDIA) LIMITED is INR ₹ 2,556.8 Cr.
What is the paid-up capital of MAKEMYTRIP (INDIA) LIMITED?
The paid-up capital of MAKEMYTRIP (INDIA) LIMITED is INR ₹ 403.5 Cr.
What is the registered address of MAKEMYTRIP (INDIA) LIMITED?
The registered address of MAKEMYTRIP (INDIA) LIMITED is 19th Floor, Tower A/B/C Epitome Building No. 5, DLF Cyber City, DLF Phase III GURUGRAM Haryana - 122002
What is the CIN number of MAKEMYTRIP (INDIA) LIMITED?
The CIN number of MAKEMYTRIP (INDIA) LIMITED is U63040HR2000PLC090846.
Smart Suggestions
- Gati Limited
- Vif Airways Ltd
- Country Condo's Limited
- Memo Logistics Private Limited
- Sai Nandeeshwar Motors Private Limited
- Travelsurf Private Limited
- Aerowings Holidays Foreign Exchange & Travel Services India Private Limited
- 24 X 7 Travel Solutions Private Limited
- Suryachandra Enterprises Private Limited
- Omkar Translogistics Private Limited
- 9Flights Services Private Limited
- Heera Haj Services Private Limited
- Tranzy Tours & Travels India Private Limited
- Hmda Ksr Integrated Terminals Private Limited
- Ptg Tours & Travels Private Limited
- Datla Cabs Private Limited
- Stc Logistics Private Limited
- Grayhound Transport Private Limited
- Zenexpress Logistics Private Limited
- My Travelmate.Com India Private Limited
- Hera Holidays Private Limited
- Tencabs Travel Private Limited
- Trycon Tours And Travels Private Limited
- Parthasarathy Transports Private Limited
- Tara Chand Logistic Solutions Limited
- Kapsons Logistics Private Limited
- Traveltech Solutions Private Limited
- Next India Traveler Private Limited
- Kanshv International Private Limited
- Nature Fresh Foodstuff Ca Store Private Limited
- Easyvisa Education Consultants Private Limited
- Bass Storage (Morinda) Private Limited
- Runthrough Secure Solutions Private Limited
- Zynovia Overseas Private Limited
- Atwal Visa Point Private Limited
- Shivdham Logistics Private Limited
- Riec Overseas Private Limited
- Blue Dot Tour And Travel Planners Private Limited
- Skyglide Travels Private Limited
- Hariom Cargo Private Limited
- Rishab Star Logistic Private Limited
- Speedy Transport Private Limited
- Sangrur Transport Private Limited
- Promt Transport Private Limited
- Zirakpur Transport Private Limited
- Accurate Transport Private Limited
- Punjab Logistics Infrastructure Limited
- Anjum Enterprises Private Limited
- Chariot World Tours Limited
- U.S. Sai Forex Private Limited
- Sri Balaji Logistics Solutions (India) Private Limited
- Rcs Logistics Private Limited
- Hubner Interface Systems (India) Private Limited
- Falcon Auto Tyres Private Limited
- Hyades Tours And Travels Private Limited
- Voyageur Lifestyles Private Limited
- Wirecard Forex India Private Limited
- Viskan Logistics Services Private Limited
- Bharath International Travels (Mysore) Private Limited
- Logilink India Private Limited
- Cabs Den Private Limited
- Access Warehousing Private Limited
- Phoennix Clearing And Forwarding Private Limited
- Ark Global Logistics Private Limited
- Jehovah Shammah Tours And Travels Private Limited
- Venkateshwara Cargo Solutions Private Limited
- Burn Boundaries Adventure Private Limited
- Zip Cab Service Private Limited
- Mapsat Transportation And Logistics Private Limited
- Tripholic Private Limited
- Suraj Solutions Private Limited
- Vaishnavi Cargo & Project Private Limited
- Shield Transference Private Limited
- Namami Gange Transporter (Opc) Private Limited
- Alax Dream Online Services Private Limited
- Limitless Travels Private Limited
- Skynet Travels & Tours Private Limited
- Rizvi Brothers Hajj And Umrah Services Private Limited
- Friends Travellage Private Limited
- Movex Shipping Private Limited
- Dhanbad Cold Storage Private Limited
- Chandrawati Coolers & Traders Private Limited
- Vardhan Cold Storage Private Limited
- Gola Cold Storage Private Limited
- Shreesainath (India) Private Limited
- Palamu Cold Storage Private Limited
- Baidyanathdham Deoghar Cold Storage Private Limited
- Subidhi Cold Storage Private Limited
- Krishna Surya Cold Storage Private Limited
- Modern Refrigeration And Allied Industries Private Limited
- Shree Bajrangbali Coldstorage Private Limited
- Banawar Agro Works Private Limited
- Jamshedpur Cold Storage Private Limited
- Container Corporation Of India Limited
- Sindhu Trade Links Limited
- International Travel House Limited
- Mfl India Limited
- Mideast (India) Limited
- Roadways India Ltd
- Jalan Transolutions (India) Limited
- Core Fleet Management Services Private Limited
- Duhan Tour & Travels Private Limited
- Supervalue Holidays & Forex Private Limited
- Seagull Maritime Agencies Private Limited
- Heritage River Journeys Private Limited
- Deviate Enterprises Private Limited
- Sheevam Transolutions Private Limited
- Max Holidays India Private Limited
- L.G.Brothers Logistics Private Limited
- Gets Holidays Private Limited
- Excel Softech Private Limited
- Parsoli Tours & Hospitality Private Limited
- Global Warehousing Private Limited
- Unique Tourism Private Limited
- United Technologies Corporation India Private Limited
- Hfm Logiware Private Limited
- Gsm Tours & Logistics (India) Private Limited
- Aeschna Transs Private Limited
- Sunrise Shipping Agencies Private Limited
- Peace Travels And Trading Private Limited
- The Royal Riders Private Limited
- Dollars And Rupees Forex Private Limited
- Tatabye Tours And Travels Private Limited
- Sweena Xella Holidays Private Limited
- Greatway Tours & Holidays Private Limited
- Yesaarkay Travels Private Limited
- Bonjour Bonheur Holidays Private Limited
- Puducherry Urban Transport Agency Limited
- Kishore Tours & Travels Private Limited
- Dayofftrip Vacation Rentals Private Limited
- Reve D-Inde Private Limited
- Travtoinde Private Limited
- Maruthi Air Links Private Limited
- Souvenir (India) Private Limited
- Chetak Travels Private Limited
- Puducherry Business Consulting Services Private Limited
- Elite Travel Services Private Limited
- Lucid Travel Solutions Private Limited (Opc)
- Thama Royalinternational Tours And Travels Private Limited
- Sangamam Leisure Management Private Limited
- Sensila Voyages Private Limited
- Rane Brake Lining Limited
- Southern Sea Crafts Limited
- Take Solutions Limited
- Matrimony.Com Limited
- Business Transport Resources India Private Limited
- Raffles Portworks Private Limited
- Bow And Arrow Management Services Private Limited
- Trp Logistics Private Limited
- Daniel & Samuel Shipping Private Limited
- Good Luck Forwarders Private Limited
- Saranya Tours & Travels Private Limited
- Safe Rider Logistics India Private Limited
- Sai Ram Air Ticket Service Private Limited
- Blue Zone Logistics Private Limited
- Aarin Hospitality Private Limited
- Sri Kamakshi Logistics Private Limited
- Chennai Bulls Logistics Private Limited
- Vetrivadivelan Travels Services Private Limited
- Star Thermoplastic Road Markings Private Limited
- Cargo International (India) Private Limited
- Grace Freight Express (India) Private Limited
- Karsen Logistics Private Limited
- Valuemytrip Travels Private Limited
- Abhisarika Holidays Private Limited
- Chalo Hoppo Private Limited
- Ovatree International Private Limited
- Travelshongi (Opc) Private Limited
- Naina Express Private Limited
- Pareek Roadlines Private Limited
- Highcane Services Private Limited
- Rds Logistics And Agencies Private Limited
- Kamrupa Thanda Ghar Private Limited
- Seven Sisters Agro Industries Limited
- Arham Cold Storage Private Limited
- Lahkar Bonded Warehouse Private Limited
- Aaryan Chilled Infra Private Limited
- Himalaya Warehousing & Logistics Private Limited
- Pratima Bey Enterprise Private Limited
- Subhalakhi Bonded Warehouse Private Limited
- Sanika Industries Private Limited
- The Gohain Borbora Tea Company Private Limited
- Gauhati Tea Warehousing Pvt Ltd
- M D Enterprises Pvt Ltd
- Deorah Commercial Private Limited
- Khemka Tea Warehousing Company Private Limited
- M Que Transport Private Limited
- Ashirbad Earth Movers Private Limited
- Kainsara Infraprojects Private Limited
- Atlanta Logistics Private Limited
- Paradeep Commercial Services Private Limited
- Landscape Ventures Private Limited
- Tour Reverie Odisha (Opc) Private Limited
- Jbs Cargo & Logistics Private Limited
- Hotrestra India Private Limited
- Eminenza Unicorp Private Limited
- Anwesha Drives Auto Car Rental Private Limited
- Anwesha Holidays Private Limited
- Paradip Mover Private Limited
- Sonhe Transport And Logistics Private Limited
- Hapasya Ventures Private Limited
- Lipsha Travel And Leisures (Opc) Private Limited
- Ashotri Solutions (Opc) Private Limited
- Hlw Cab Services Private Limited
- Pyh Tours Private Limited
- Ysme Toooro Private Limited
- Transdesk Logistics Private Limited
- Seavision Shipping Private Limited
- Yascom Enterprises Private Limited
- Lamira Logistics Private Limited
- Abc India Limited
- Cyber Family. Com Limited
- Deepak Industries Ltd
- Spiral Pack (India) Ltd
- Prudential International Ltd
- T. Spiritual World Limited
- Andrew Yule & Co Ltd
- Mcleod & Co Ltd
- Calicut Engineering Works Ltd
- Premier Road Carriers Ltd
- Coastal Roadways Ltd
- Western Fe-Alloys Ltd
- Rtl Logistics Limited
- Frontline Corporation Limited
- Emami Limited
- C.C. Logistics Private Limited
- Seven Star Air Travel Private Limited
- Bbn Logistics Private Limited
- Roxrular Travel Private Limited
- Top 10 Mobile Companies in India
- Top 10 Logistics Companies in India
- Top 10 IT Companies in India
- Top 10 FMCG Companies in India
- Top 10 MNC Companies in India
- Top 10 Healthcare Companies in India
- Top 10 Pharma Companies in India
- Top 10 Tiles Company in India
- Top 10 Network Marketing Companies in India
- How to Choose Top Marketing Research Website in India
- Financial Terms
- Business Documents
- Company Financial Reports
- Efficiency Ratio
- Balance Sheet
- Debt to Equity Ratio
- Liquidity Ratio
- Profit and Loss
- Profitability Ratio
- Ratio Analysis
- Solvency Ratio
- EBITDA
- Quick Ratio
- Capital Structure
- Networth
- Current Ratio
- Interest Coverage Ratio
- Assets
- Accounts Payable
- Liabilities
- Revenue
- Memorandum of Association
- Articles of Association
