1. Executive Summary
India's pharmaceutical sector has built one of the world's largest generic drug industries, supplying medicines across regulated and emerging markets globally. This benchmarking study tracks 30 leading companies across API manufacturing, formulations, CDMOs, and branded domestic pharmaceuticals, spanning both listed and unlisted entities, and covers five years of audited financial data from FY21 through FY25.
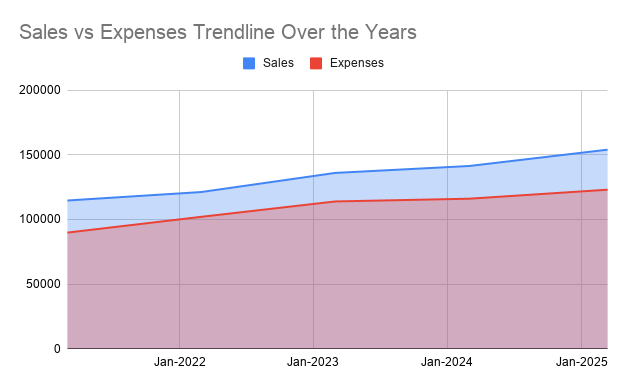
Combined revenues for the sample grew from ₹1,14,649 crore in FY21 to ₹1,54,008.7 crore in FY25, a four-year compound growth rate of approximately 7.6%. Unlike India's capital-light IT sector, pharma is a manufacturing-intensive industry – total borrowings across the 30 companies stood at ₹27,762.4 crore in FY25, reflecting the sustained capital investment required in plant compliance, capacity, and product development.
Revenue and Profit Trends
- Sector revenues grew 34.3% over four years, with meaningful acceleration in FY23 as domestic market demand and export recovery gained momentum.
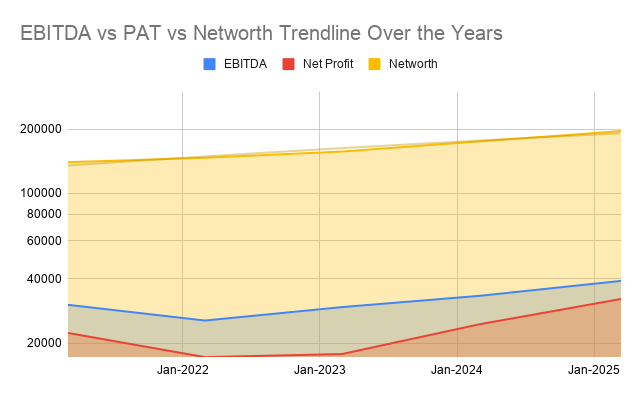
- Operating profit expanded from ₹30,196.9 crore in FY21 to ₹39,054.8 crore in FY25, though operating margins compressed sharply from 26.3% to 21.0% in FY22 as API input cost inflation and US generics pricing pressure weighed heavily on profitability.
- Net margins dipped from 19.5% in FY21 to 13.1% in FY23, before recovering to 20.9% in FY25 – the strongest net margin in the five-year period – as input costs eased, US compliance records improved, and complex generics contributed more meaningfully to the revenue mix.
- Net profit grew from ₹22,314.9 crore in FY21 to ₹32,153.5 crore in FY25, with the sharpest recovery coming in FY24 and FY25.
- Networth strengthened from ₹1,39,994.9 crore to ₹1,95,600.5 crore, funded by retained earnings as profitability recovered.
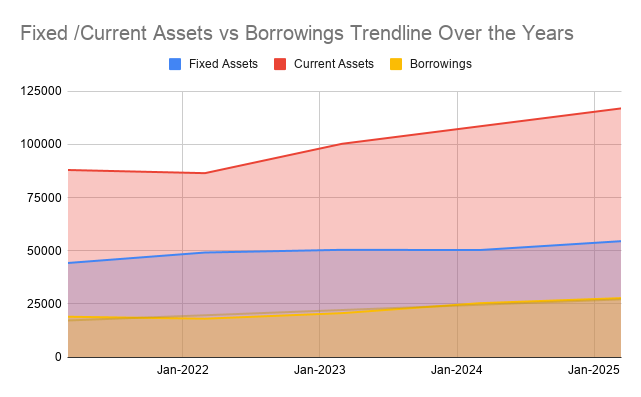
- Total assets expanded from ₹1,91,456.9 crore to ₹2,61,821.9 crore, with fixed assets growing from ₹44,274.4 crore to ₹54,529.5 crore – reflecting the sector's ongoing investment in manufacturing capacity and USFDA-compliant infrastructure.
- Total borrowings grew from ₹19,007.6 crore to ₹27,762.4 crore, a 46% increase, driven by capital expenditure and working capital requirements as the sector scaled operations.
| Particulars (INR Cr.) | Mar-2021 | Mar-2022 | Mar-2023 | Mar-2024 | Mar-2025 |
|---|---|---|---|---|---|
| Sales | 1,14,649.0 | 1,21,214.5 | 1,35,997.1 | 1,41,374.4 | 1,54,008.7 |
| Operating Profit | 30,196.9 | 25,495.1 | 29,457.1 | 33,255.0 | 39,054.8 |
| Net Profit | 22,314.9 | 17,196.2 | 17,782.6 | 24,495.0 | 32,153.5 |
| Networth | 1,39,994.9 | 1,46,778.7 | 1,57,030.4 | 1,75,030.9 | 1,95,600.5 |
| Borrowings | 19,007.6 | 18,079.8 | 20,695.5 | 25,370.8 | 27,762.4 |
| Assets | 1,91,456.9 | 2,00,400.8 | 2,14,231.8 | 2,34,214.8 | 2,61,821.9 |
| Operating Margin | 26.34% | 21.03% | 21.66% | 23.52% | 25.36% |
| Net Margin | 19.46% | 14.19% | 13.08% | 17.33% | 20.88% |
2. Methodology
This study is based on five years of audited financial data for 30 leading pharmaceutical companies in India, covering both listed and unlisted entities across API manufacturing, formulation, CDMO, and branded domestic pharmaceuticals. The objective was to evaluate sector-wide performance trends, profitability patterns, balance-sheet health, and efficiency metrics using standardised financial data and comparable benchmarks.
2.1 Data Sources
All financial data used in this study was sourced exclusively from Tofler.in, including:
- Profit & Loss Statements
- Balance Sheets
- Cash Flow Statements
- Financial Highlights
- Ratios & Margins
Only audited financials were considered for the analysis.
2.2 Company Selection
The study covers 30 companies representing the major segments of India's pharmaceutical landscape. Companies were selected based on:
- Scale of operations (revenue and asset base)
- Representation across the pharma value chain: API manufacturers, formulation companies, CDMOs, and branded domestic players
- Mix of listed and unlisted entities to reflect the sector's true structure
- Subsector diversity: regulated market exporters, domestic-focused brands, and contract manufacturers
- Availability of consistent FY21 to FY25 audited financial data
Companies Used for Analysis:
These companies together represent the full range of India's pharmaceutical landscape, from large-cap exporters and CDMO specialists to branded domestic players and API manufacturers, spanning both listed and unlisted entities.
2.3 Scope of Analysis & Metrics Used
This study covers five years of audited financial data (FY21 to FY25) for 30 major pharmaceutical companies, with the objective of assessing sector-wide growth, profitability patterns, balance-sheet health, and operational efficiency.
Key Metrics Analyzed:
- Growth Metrics: Sales CAGR, EBITDA CAGR (3-year, FY22 to FY25)
- Profitability Metrics: Gross Margin, Operating Margin, Net Margin, EBITDA, Net Profit
- Cost Structure: Cost of Goods, Employee Costs, Other Operating Costs
- Balance Sheet Metrics: Borrowings (short-term and long-term), Networth, Total Assets, Fixed Assets, Debt/Equity
- Efficiency Metrics: Asset Turnover, Days Receivable, Days Payable, Days Inventory, Working Capital Days, Cash Conversion Cycle
Analytical Approach:
- Aggregating all 30 companies to compute sector-level totals and trends across FY21 to FY25
- Computing 3-year CAGRs (FY22 to FY25) for sales and EBITDA at the individual company level
- Benchmarking ratios using sector means and medians for realistic cross-company comparisons
- Analysing cash efficiency through cash conversion cycle and working capital day metrics
3. Industry Aggregates And Trends
| Particulars (INR Cr.) | Mar-2021 | Mar-2022 | Mar-2023 | Mar-2024 | Mar-2025 |
|---|---|---|---|---|---|
| Sales | 1,14,649.0 | 1,21,214.5 | 1,35,997.1 | 1,41,374.4 | 1,54,008.7 |
| Expenses | 89,803.1 | 1,02,019.4 | 1,13,917.4 | 1,16,047.9 | 1,23,016.2 |
| Particulars (INR Cr.) | Mar-2021 | Mar-2022 | Mar-2023 | Mar-2024 | Mar-2025 |
|---|---|---|---|---|---|
| EBITDA | 30,196.9 | 25,495.1 | 29,457.1 | 33,255.0 | 39,054.8 |
| Net Profit | 22,314.9 | 17,196.2 | 17,782.6 | 24,495.0 | 32,153.5 |
| Networth | 1,39,994.9 | 1,46,778.7 | 1,57,030.4 | 1,75,030.9 | 1,95,600.5 |
| Particulars (INR Cr.) | Mar-2021 | Mar-2022 | Mar-2023 | Mar-2024 | Mar-2025 |
|---|---|---|---|---|---|
| Fixed Assets | 44,274.4 | 49,197.3 | 50,465.7 | 50,356.6 | 54,529.5 |
| Current Assets | 88,002.4 | 86,513.0 | 1,00,325.3 | 1,08,529.3 | 1,16,966.8 |
| Borrowings | 19,007.6 | 18,079.8 | 20,695.5 | 25,370.8 | 27,762.4 |
4. Three Year Sales CAGR of the Companies
| Company Name | FY2022 (INR Cr.) | FY2025 (INR Cr.) | 3-Year Sales CAGR |
|---|---|---|---|
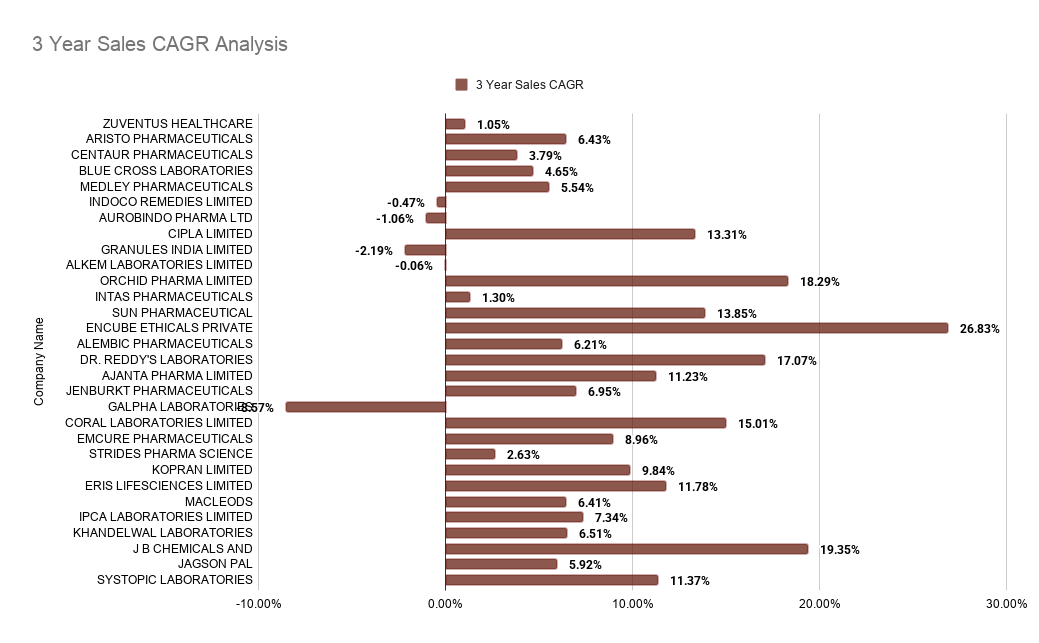
| ENCUBE ETHICALS PRIVATE LIMITED | 642.9 | 1,311.6 | 26.83% |
| J B CHEMICALS AND PHARMACEUTICALS LIMITED | 2,189.9 | 3,722.9 | 19.35% |
| ORCHID PHARMA LIMITED | 557.0 | 921.9 | 18.29% |
| DR. REDDY'S LABORATORIES LTD | 14,405.2 | 23,115.4 | 17.07% |
| CORAL LABORATORIES LIMITED | 75.6 | 115.0 | 15.01% |
| SUN PHARMACEUTICAL INDUSTRIES LIMITED | 15,586.0 | 23,003.3 | 13.85% |
| CIPLA LIMITED | 13,091.8 | 19,044.8 | 13.31% |
| ERIS LIFESCIENCES LIMITED | 1,215.7 | 1,697.8 | 11.78% |
| SYSTOPIC LABORATORIES PRIVATE LIMITED | 656.9 | 907.4 | 11.37% |
| AJANTA PHARMA LIMITED | 3,140.6 | 4,322.0 | 11.23% |
| KOPRAN LIMITED | 204.5 | 271.0 | 9.84% |
| EMCURE PHARMACEUTICALS LIMITED | 3,387.2 | 4,381.9 | 8.96% |
| IPCA LABORATORIES LIMITED | 5,399.4 | 6,677.9 | 7.34% |
| JENBURKT PHARMACEUTICALS LTD | 124.0 | 151.7 | 6.95% |
| KHANDELWAL LABORATORIES PRIVATE LIMITED | 198.3 | 239.6 | 6.51% |
| ARISTO PHARMACEUTICALS PRIVATE LIMITED | 4,098.7 | 4,941.2 | 6.43% |
| MACLEODS PHARMACEUTICALS LTD | 7,462.7 | 8,991.4 | 6.41% |
| ALEMBIC PHARMACEUTICALS LIMITED | 5,035.4 | 6,032.6 | 6.21% |
| JAGSON PAL PHARMACEUTICALS LIMITED | 226.1 | 268.7 | 5.92% |
| MEDLEY PHARMACEUTICALS LIMITED | 755.7 | 888.4 | 5.54% |
| BLUE CROSS LABORATORIES PRIVATE LIMITED | 873.6 | 1,001.3 | 4.65% |
| CENTAUR PHARMACEUTICALS PRIVATE LIMITED | 925.1 | 1,034.4 | 3.79% |
| STRIDES PHARMA SCIENCE LIMITED | 1,979.0 | 2,139.4 | 2.63% |
| INTAS PHARMACEUTICALS LIMITED | 12,653.5 | 13,154.0 | 1.30% |
| ZUVENTUS HEALTHCARE LIMITED | 1,051.4 | 1,085.0 | 1.05% |
| ALKEM LABORATORIES LIMITED | 8,829.8 | 8,813.4 | -0.06% |
| INDOCO REMEDIES LIMITED | 1,539.7 | 1,518.2 | -0.47% |
| AUROBINDO PHARMA LTD | 11,287.1 | 10,933.3 | -1.06% |
| GRANULES INDIA LIMITED | 3,238.4 | 3,030.2 | -2.19% |
| GALPHA LABORATORIES LIMITED | 383.3 | 293.0 | -8.57% |
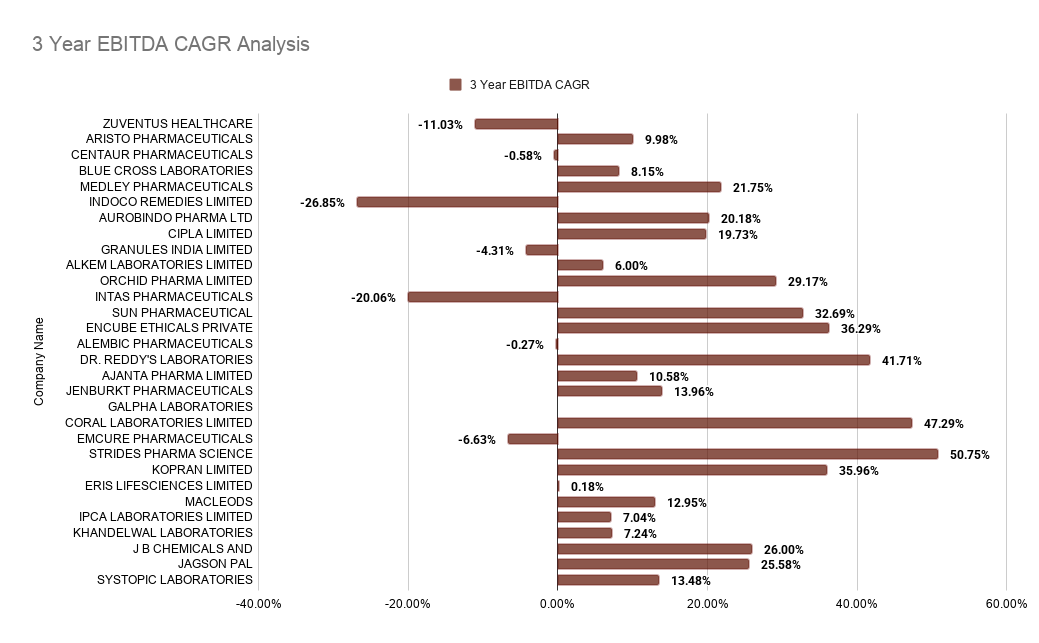
5. Three Year EBITDA CAGR of the Companies
| Company Name | FY2022 (INR Cr.) | FY2025 (INR Cr.) | 3-Year EBITDA CAGR |
|---|---|---|---|
| STRIDES PHARMA SCIENCE LIMITED | 76.6 | 262.4 | 50.75% |
| CORAL LABORATORIES LIMITED | 8.2 | 26.2 | 47.29% |
| DR. REDDY'S LABORATORIES LTD | 2,594.1 | 7,381.8 | 41.71% |
| ENCUBE ETHICALS PRIVATE LIMITED | 182.9 | 463.0 | 36.29% |
| KOPRAN LIMITED | 15.4 | 38.7 | 35.96% |
| SUN PHARMACEUTICAL INDUSTRIES LIMITED | 2,907.5 | 6,792.6 | 32.69% |
| ORCHID PHARMA LIMITED | 57.3 | 123.5 | 29.17% |
| J B CHEMICALS AND PHARMACEUTICALS LIMITED | 508.9 | 1,017.9 | 26.00% |
| JAGSON PAL PHARMACEUTICALS LIMITED | 25.8 | 51.1 | 25.58% |
| MEDLEY PHARMACEUTICALS LIMITED | 159.1 | 287.1 | 21.75% |
| AUROBINDO PHARMA LTD | 1,473.4 | 2,557.6 | 20.18% |
| CIPLA LIMITED | 3,366.5 | 5,778.4 | 19.73% |
| JENBURKT PHARMACEUTICALS LTD | 27.3 | 40.4 | 13.96% |
| SYSTOPIC LABORATORIES PRIVATE LIMITED | 45.3 | 66.2 | 13.48% |
| MACLEODS PHARMACEUTICALS LTD | 1,559.0 | 2,246.2 | 12.95% |
| AJANTA PHARMA LIMITED | 890.9 | 1,204.7 | 10.58% |
| ARISTO PHARMACEUTICALS PRIVATE LIMITED | 1,457.8 | 1,939.5 | 9.98% |
| BLUE CROSS LABORATORIES PRIVATE LIMITED | 262.8 | 332.4 | 8.15% |
| KHANDELWAL LABORATORIES PRIVATE LIMITED | 9.0 | 11.1 | 7.24% |
| IPCA LABORATORIES LIMITED | 1,243.5 | 1,525.0 | 7.04% |
| ALKEM LABORATORIES LIMITED | 1,810.4 | 2,156.2 | 6.00% |
| ERIS LIFESCIENCES LIMITED | 484.0 | 486.6 | 0.18% |
| ALEMBIC PHARMACEUTICALS LIMITED | 908.8 | 901.4 | -0.27% |
| CENTAUR PHARMACEUTICALS PRIVATE LIMITED | 272.7 | 268.0 | -0.58% |
| GRANULES INDIA LIMITED | 644.6 | 564.8 | -4.31% |
| EMCURE PHARMACEUTICALS LIMITED | 794.7 | 646.8 | -6.63% |
| ZUVENTUS HEALTHCARE LIMITED | 273.1 | 192.3 | -11.03% |
| INTAS PHARMACEUTICALS LIMITED | 3,094.4 | 1,580.6 | -20.06% |
| INDOCO REMEDIES LIMITED | 327.0 | 128.0 | -26.85% |
| GALPHA LABORATORIES LIMITED | 14.1 | -15.7 | NA |
6. Cash Efficiency of the Companies
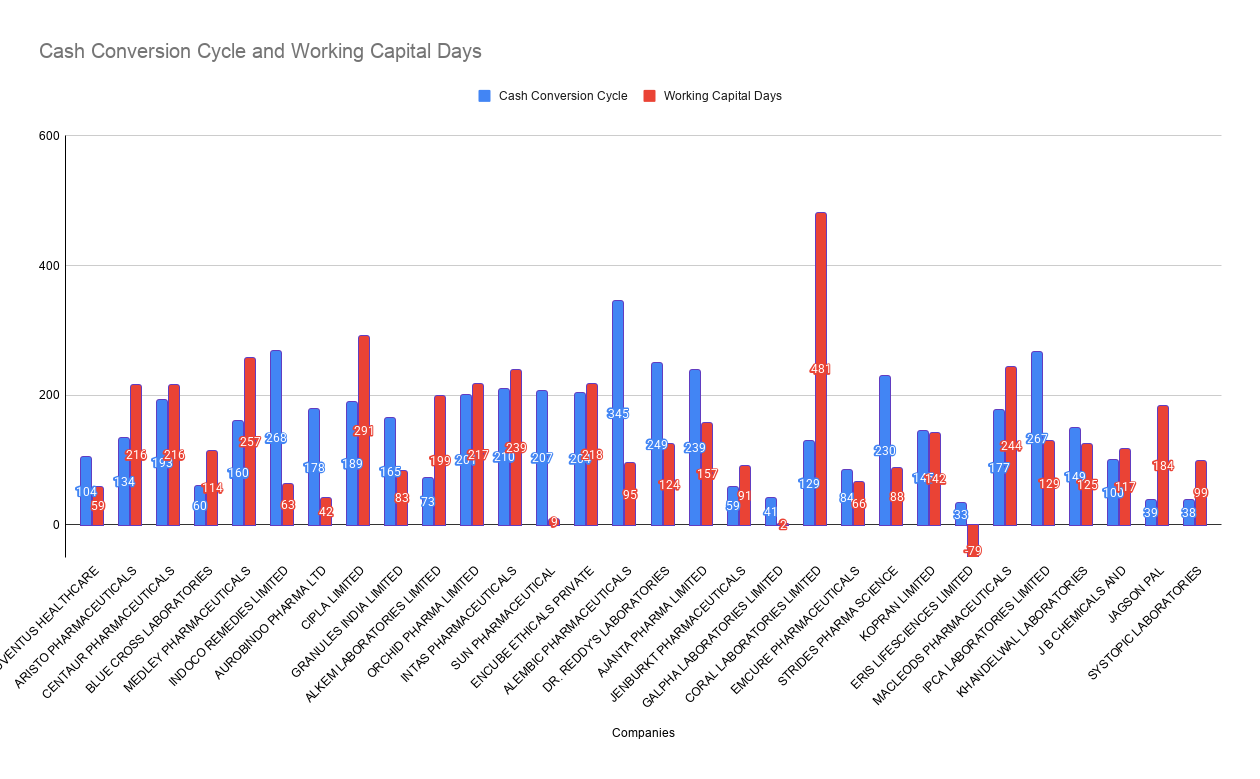
Cash efficiency reflects how effectively a company converts its operating activities into cash. The Cash Conversion Cycle (CCC) and Working Capital Days show how quickly a company cycles through inventory, collects receivables, and pays suppliers. The mean CCC across the 30 companies was 155.7 days (median: 162.5 days) and Working Capital Days averaged 142.9 days (median: 124.5 days).
| Company Name | Cash Conversion Cycle (Days) | Working Capital Days |
|---|---|---|
| ALEMBIC PHARMACEUTICALS LIMITED | 345 | 95 |
| INDOCO REMEDIES LIMITED | 268 | 63 |
| IPCA LABORATORIES LIMITED | 267 | 129 |
| DR. REDDY'S LABORATORIES LTD | 249 | 124 |
| AJANTA PHARMA LIMITED | 239 | 157 |
| STRIDES PHARMA SCIENCE LIMITED | 230 | 88 |
| INTAS PHARMACEUTICALS LIMITED | 210 | 239 |
| SUN PHARMACEUTICAL INDUSTRIES LIMITED | 207 | 9 |
| ENCUBE ETHICALS PRIVATE LIMITED | 204 | 218 |
| ORCHID PHARMA LIMITED | 201 | 217 |
| CENTAUR PHARMACEUTICALS PRIVATE LIMITED | 193 | 216 |
| CIPLA LIMITED | 189 | 291 |
| AUROBINDO PHARMA LTD | 178 | 42 |
| MACLEODS PHARMACEUTICALS LTD | 177 | 244 |
| GRANULES INDIA LIMITED | 165 | 83 |
| MEDLEY PHARMACEUTICALS LIMITED | 160 | 257 |
| KHANDELWAL LABORATORIES PRIVATE LIMITED | 149 | 125 |
| KOPRAN LIMITED | 145 | 142 |
| ARISTO PHARMACEUTICALS PRIVATE LIMITED | 134 | 216 |
| CORAL LABORATORIES LIMITED | 129 | 481 |
| ZUVENTUS HEALTHCARE LIMITED | 104 | 59 |
| J B CHEMICALS AND PHARMACEUTICALS LIMITED | 100 | 117 |
| EMCURE PHARMACEUTICALS LIMITED | 84 | 66 |
| ALKEM LABORATORIES LIMITED | 73 | 199 |
| BLUE CROSS LABORATORIES PRIVATE LIMITED | 60 | 114 |
| JENBURKT PHARMACEUTICALS LTD | 59 | 91 |
| GALPHA LABORATORIES LIMITED | 41 | 2 |
| JAGSON PAL PHARMACEUTICALS LIMITED | 39 | 184 |
| SYSTOPIC LABORATORIES PRIVATE LIMITED | 38 | 99 |
| ERIS LIFESCIENCES LIMITED | 33 | -79 |
7. Financial Ratios And Benchmarks
The table below presents sector-wide benchmarks across key financial ratios for FY25, computed as the mean and median across all 30 companies, alongside the minimum and maximum observed values. These benchmarks serve as reference points for evaluating individual company performance relative to the broader pharma sector.
7.1 Solvency
| Ratio | Mean | Median | Min | Max |
|---|---|---|---|---|
| Total Debt / Equity | 0.02 | 0.00 | -3.3 | 0.9 |
| Net Debt / Equity | 0.01 | 0.00 | -3.2 | 0.8 |
| Total Debt / Assets | 0.10 | 0.00 | 0.0 | 0.8 |
| Total Assets / Equity | 1.2 | 1.3 | -3.9 | 2.1 |
7.2 Liquidity
| Ratio | Mean | Median | Min | Max |
|---|---|---|---|---|
| Current Ratio | 3.34 | 2.95 | 0.6 | 13.3 |
| Quick Ratio | 2.56 | 2.00 | 0.4 | 10.5 |
| Interest Coverage | 98.3 | 31.5 | -2.1 | 382.4 |
7.3 Performance
| Ratio | Mean | Median | Min | Max |
|---|---|---|---|---|
| Gross Margin | 64.09% | 67.60% | 40.9% | 80.5% |
| Operating Margin | 21.29% | 23.10% | -5.3% | 39.2% |
| Net Margin | 16.42% | 17.65% | -6.3% | 57.6% |
7.4 Return
| Ratio | Mean | Median | Min | Max |
|---|---|---|---|---|
| Return on Equity (ROE) | 18.23% | 16.15% | -0.8% | 90.4% |
| Pre-tax ROCE | 24.40% | 22.40% | -65.5% | 90.6% |
| Return on Assets (ROA) | 13.45% | 12.75% | -9.9% | 57.4% |
| Pre-tax ROIC | 16.67% | 16.10% | -19.6% | 92.8% |
7.5 Efficiency
| Ratio | Mean | Median | Min | Max |
|---|---|---|---|---|
| Days Payable | 116.3 days | 116 days | 33 days | 210 days |
| Days Inventory | 186.6 days | 179.5 days | 53 days | 403 days |
| Days Receivable | 85.4 days | 86.5 days | 2 days | 248 days |
| Fixed Asset Turnover | 8.44 | 2.85 | 0.7 | 128.9 |
| Total Asset Turnover | 0.82 | 0.70 | 0.3 | 2.7 |
| Cash Conversion Cycle | 155.7 days | 162.5 days | 33 days | 345 days |
| Working Capital Days | 142.9 days | 124.5 days | -79 days | 481 days |
8. Borrowings Trend of the Companies
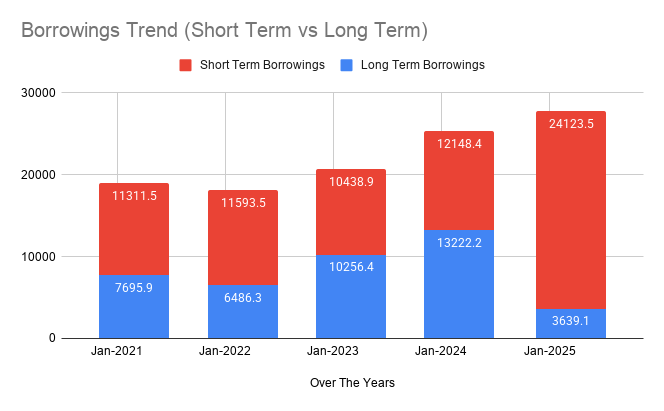
Total borrowings across the 30 pharma companies grew from ₹19,007.6 crore in FY21 to ₹27,762.4 crore in FY25, a 46% increase. The composition of borrowings shifted significantly – long-term debt declined from ₹7,695.9 crore to ₹3,639.1 crore, while short-term borrowings surged from ₹11,311.5 crore to ₹24,123.5 crore, reflecting increased working capital financing needs as trade receivables and inventories expanded alongside revenue growth.
| Particulars (INR Cr.) | Mar-2021 | Mar-2022 | Mar-2023 | Mar-2024 | Mar-2025 |
|---|---|---|---|---|---|
| Short Term Borrowings | 11,311.5 | 11,593.5 | 10,438.9 | 12,148.4 | 24,123.5 |
| Long Term Borrowings | 7,695.9 | 6,486.3 | 10,256.4 | 13,222.2 | 3,639.1 |
| Total Borrowings | 19,007.6 | 18,079.8 | 20,695.5 | 25,370.8 | 27,762.4 |
9. Top 3 Companies By Key Metrics (FY25)
The tables below spotlight the three highest-ranking companies across four key financial metrics in FY25 – Sales, EBITDA, Net Profit, and Gross Margin – drawing from the full sample of 30 companies.
9.1 Top 3 by Sales
| Company Name | Sales (INR Cr.) | EBITDA (INR Cr.) | Net Profit (INR Cr.) |
|---|---|---|---|
| DR. REDDY'S LABORATORIES LTD | 23,115.4 | 7,381.8 | 5,349.4 |
| SUN PHARMACEUTICAL INDUSTRIES LIMITED | 23,003.3 | 6,792.6 | 4,282.6 |
| CIPLA LIMITED | 19,044.8 | 5,778.4 | 5,157.6 |
9.2 Top 3 by Borrowings
| Company Name | Sales (INR Cr.) | Net Profit (INR Cr.) | Borrowings (INR Cr.) |
|---|---|---|---|
| SUN PHARMACEUTICAL INDUSTRIES LIMITED | 23,003.3 | 4,282.6 | 10,954.5 |
| AUROBINDO PHARMA LTD | 10,933.3 | 1,746.8 | 4,625.1 |
| DR. REDDY'S LABORATORIES LTD | 23,115.4 | 5,349.4 | 3,385.5 |
9.3 Top 3 by Gross Margin
| Company Name | Sales (INR Cr.) | Net Profit (INR Cr.) | Gross Margin (%) |
|---|---|---|---|
| JENBURKT PHARMACEUTICALS LTD | 151.7 | 32.1 | 80.5% |
| MEDLEY PHARMACEUTICALS LIMITED | 888.4 | 239.7 | 77.3% |
| AJANTA PHARMA LIMITED | 4,322.0 | 916.9 | 76.6% |
10. Industry Context & Market Landscape
10.1 Market Landscape (National View)
India is the third-largest pharmaceutical producer by volume globally and the largest supplier of generic medicines – accounting for ~20% of global generic drug exports and over 50% of global vaccine demand. The 30 companies tracked in this report grew combined revenues from ₹1,14,649 crore in FY21 to ₹1,54,008.7 crore in FY25, with operating margins recovering to 25.4% by FY25 after a trough in FY22.
- Generic export powerhouse: India accounts for ~47% of all ANDAs approved by the USFDA annually, making it indispensable to the US healthcare supply chain.
- Capital-intensive structure: Unlike IT, pharma demands sustained capex in plant compliance and logistics. Total borrowings across this study's companies grew from ₹19,008 crore to ₹27,762 crore between FY21 and FY25.
- Domestic branded generics: The Indian market runs on a doctor-prescription-driven branded generics model. Chronic categories – diabetes, cardiovascular, respiratory – are the dominant and fastest-growing segment.
- CDMO & API opportunity: India is positioning as a global CDMO hub, with the PLI scheme accelerating domestic API production to reduce dependency on China.
- Biosimilars platform: Several companies have built dedicated biologics manufacturing to target regulated-market biosimilar opportunities as major biologic patents expire.
10.2 Regional Distribution
Major Manufacturing Clusters
- Gujarat (Ahmedabad, Vadodara, Ankleshwar): India's largest pharma manufacturing hub by concentration, with a high share of USFDA-approved facilities. Home to Sun Pharmaceutical and Alembic Pharmaceuticals.
- Telangana & Andhra Pradesh (Hyderabad, Visakhapatnam): India's dominant API hub – Hyderabad is known as "Bulk Drug City." Headquarters of Dr. Reddy's Laboratories and Aurobindo Pharma.
- Maharashtra (Mumbai, Pune, Nashik): Centre for domestic branded generics, corporate HQs, and regulatory affairs. Home to Cipla, Emcure, Medley, Encube Ethicals, and others.
- Himachal Pradesh & Uttarakhand (Baddi, Haridwar): Tax-incentive-driven formulation clusters. Baddi is one of Asia's largest pharma manufacturing towns by plant count.
Emerging Clusters
- Sikkim and the Northeast are growing as formulation hubs on the back of government incentives for pharmaceutical investment.
- Tamil Nadu (Chennai, Hosur) is emerging as a centre for injectables, medical devices, and API contract manufacturing.
- Bulk Drug Parks under PLI are being developed in Andhra Pradesh, Himachal Pradesh, and Gujarat to domestically source APIs currently imported from China.
11. Industry Structure And Business Model
India's pharmaceutical industry operates through four core segments – API manufacturers, formulation companies, CDMOs, and branded domestic players – with most large listed companies active across more than one. The sector's fundamental edge is producing high-quality medicines at a fraction of Western cost.
11.1 Industry Structure Overview
| Segment | Role / Examples | Core Strengths | Limitations |
|---|---|---|---|
| API Manufacturers | Produce the active chemical ingredient; supply formulation companies globally and domestically | Low cost, process chemistry expertise, bulk volume capabilities | Dependent on Chinese starting materials; exposed to raw material price cycles |
| Formulation Companies | Convert APIs into finished dosage forms (tablets, injectables, capsules) for domestic and export markets | Scale, multi-geography regulatory approvals, established distribution | USFDA compliance costs; pricing pressure from generics competition |
| CDMO / Contract Research | Manufacture drugs on behalf of innovator or generic companies; handle process development and scale-up | Recurring revenue, growing global outsourcing trend, maximises asset utilisation | High capex; customer concentration risk; IP stays with client |
| Branded Domestic Players | Sell branded generics to Indian patients through prescription and retail pharmacy channels | Brand recall, doctor relationships, recurring demand from chronic therapy | DPCO limits pricing power; doctor detailing is a significant, recurring cost |
11.2 Value Chain and Delivery Model
The value chain runs from chemical synthesis → API manufacturing → formulation & packaging → domestic or export distribution. Indian companies have built their strongest positions at the formulation stage – the highest-value step in the generic drug chain. For the US market, USFDA-approved plants are non-negotiable, creating a meaningful cost floor that separates globally ambitious companies from domestic-only players. In the domestic market, doctors are the primary decision-maker, giving companies with large field-force networks a durable structural advantage.
11.3 Margin Pools by Segment
- Regulated market generics (US, EU, Australia): High revenue per unit, but significant compliance overhead. Margin is driven by first-to-file wins and complex product mix. Sun Pharma and Dr. Reddy's derive the largest share of revenues here.
- Domestic branded generics: Stable, recurring demand with structurally higher gross margins. Ajanta Pharma and Medley Pharmaceuticals – both above 75% gross margin in FY25 – operate predominantly in this segment.
- API supply: Lower margins, cyclical, and volume-driven. Margins compress when Chinese producers resume full output after disruptions.
- CDMO / contract manufacturing: Growing margin pool as innovator companies outsource to India and diversify away from China.
12. Innovation And Upcoming Business Models
12.1 Biosimilars and Complex Biologics
Indian pharma is moving beyond small-molecule generics into biosimilars – lower-cost versions of biologic drugs used to treat cancer, autoimmune conditions, and diabetes. Companies that secure early US/EU biosimilar approvals benefit from limited-competition windows that protect margins far better than commodity generics. Growing intangible assets and CWIP balances across the sample reflect this sustained R&D investment.
12.2 CDMO Expansion
Global innovators are accelerating outsourcing of drug development and manufacturing, and India is the primary destination. Indian CDMOs offer lower labour costs, process chemistry depth, existing regulatory approvals, and strong capacity utilisation. The sector's fixed-asset base grew from ₹44,274 crore to ₹54,529 crore between FY21 and FY25, partly reflecting this capacity build.
12.3 Complex Generics and Specialty Pharma
As commodity US generics face relentless price erosion, companies are deliberately pivoting to complex generics – modified-release formulations, transdermals, inhalation products, injectables, and ophthalmics. These require more sophisticated manufacturing, have fewer competitors at approval, and command more durable margins than standard oral solids.
12.4 Digital Health and DTC Models
Online pharmacy platforms have created a parallel distribution channel for prescription and OTC drugs. Companies are also investing in digital adherence tools and chronic disease management platforms. While the traditional field-force model stays dominant, digital engagement is increasingly shaping brand strategy, particularly in high-retention chronic therapy segments.
13. Policy, Schemes & Recent Developments
13.1 Production Linked Incentive (PLI) Scheme
The PLI scheme for pharma runs across two tranches: one targeting high-value generics and biopharmaceuticals, the other targeting key starting materials and drug intermediates to cut dependence on Chinese API inputs. Incentives are incremental and sales-based – companies invest first, receive payouts over multiple years as they exceed a production threshold. The scheme has already prompted measurable investment in new API plants across Telangana, Gujarat, and Himachal Pradesh.
13.2 Pradhan Mantri Bhartiya Janaushadhi Pariyojana (PMBJP)
The Jan Aushadhi programme sells generic drugs through dedicated outlets at prices substantially below branded equivalents. Its competitive impact on the larger companies in this study is limited – they operate through a doctor-prescription-driven channel that Jan Aushadhi's government-tender procurement model does not directly compete with.
13.3 Drug Pricing and DPCO
The Drug Price Control Order (DPCO) sets ceiling prices for drugs on the National List of Essential Medicines (NLEM). When a company's high-volume branded product gets added to NLEM, the revenue hit is immediate and unavoidable. Export-oriented companies are largely insulated; domestic-focused players face a structural constraint on pricing power that no volume growth can fully offset in the short term.
13.4 USFDA Compliance
India has more USFDA-approved manufacturing plants outside the US than any other country. Maintaining that standing requires continuous investment in quality systems, plant upgrades, and documentation. A single import alert or warning letter can block US shipments from a facility for years, with direct revenue impact – a key reason for the wide performance variance visible across companies in this study.
14. Sector Challenges & Risks
| Challenge | Impact on the Sector | Who is Most Affected |
|---|---|---|
| API import dependence on China | Disruptions – from regulatory shutdowns or geopolitical friction – translate into raw material cost spikes and production delays for formulators and API producers alike. | API-heavy companies and those in molecules where China dominates global starting material supply. |
| US generics pricing erosion | Buyer consolidation among US pharmacy chains drives persistent price erosion on commodity oral solids. Companies absorb declines while simultaneously funding complex product pipelines. | Large and mid-size exporters with high oral solid generics exposure in the US. |
| USFDA compliance risk | An import alert or warning letter blocks all US shipments from that plant. Compliance cost – plant upgrades, quality systems, consultants – is a significant recurring operating burden. | All US-facing companies; risk is most concentrated where a single facility represents a large revenue share. |
| Domestic price controls (DPCO) | NLEM revisions impose immediate ceiling prices on included products, with no short-term volume offset available to the affected company. | Domestic-focused branded generic companies in therapeutic categories periodically reviewed for price control. |
| Input cost volatility | Specialty chemical and solvent prices are volatile and hard to pass through in markets constrained by price controls or competitive dynamics. Gross margins in this study range from 40.9% to 80.5%, partly reflecting differential exposure. | API manufacturers most directly; vertically integrated formulators are better insulated. |
| Leverage and borrowing risk | Total borrowings grew from ₹19,008 crore to ₹27,762 crore (FY21–FY25), with short-term borrowings nearly doubling. Rising rates increase the cost of this debt and raise refinancing risk. | Companies with high leverage and recent large capex programmes not yet generating commensurate revenue. |
| Currency risk | Export revenues are in foreign currency; operating costs and debt are largely in INR. Rupee appreciation erodes margins on both the revenue and liability sides simultaneously. | Large export-oriented companies with both US/EU revenues and INR-denominated borrowings. |
15. Opportunities & Future Outlook
15.1 Growth Areas
- Complex generics pipeline: Each new USFDA approval on a complex product with limited competition represents a multi-year margin-protected revenue opportunity. Companies with clean regulatory records and a complex-product-heavy pipeline are best positioned.
- Biosimilars in global markets: Major biologics coming off patent in the US and EU are opening a structurally higher-margin opportunity than small-molecule generics, with higher barriers to entry. Indian companies with biologics manufacturing capability are well placed.
- CDMO / outsourced manufacturing: Global pharma companies are accelerating outsourcing and diversifying away from China. India's cost, process depth, and regulatory approvals make it the default destination. Fixed-asset growth in this study's aggregate data reflects the sector's capacity build for this demand.
- Chronic disease domestic market: Rising incidence of diabetes, cardiovascular disease, and respiratory disorders is driving steady domestic market growth. Branded generic companies with wide distribution and chronic therapy portfolios face less currency and compliance risk than their export peers.
- Africa and emerging markets: Several companies have established significant African and Southeast Asian businesses in affordable generics for public health programmes and private retail – a meaningful and underpenetrated growth runway.
15.2 Strategic Priorities
- Shift toward complex and differentiated products: Commodity generics face structural pricing headwinds. Companies invested in complex generics, specialty injectables, or biosimilars will sustain better margin stability.
- Reduce API import dependency: Backward-integrated API capacity reduces supply chain vulnerability. The PLI scheme financially incentivises this shift, and early movers gain a structural cost advantage.
- Strengthen USFDA compliance: A single import alert can cost years of US revenue. Continuous investment in plant quality systems and digital documentation is non-negotiable for companies with US ambitions.
- Manage leverage prudently: With borrowings up 46% since FY21 and rates still elevated, companies with strong operating cash flow and disciplined capital allocation are better placed to fund growth without excessive refinancing risk.
16. Conclusion
The 30 companies in this study grew combined revenues from ₹1,14,649 crore to ₹1,54,009 crore and net profit from ₹22,315 crore to ₹32,154 crore over FY21–FY25. Operating margins, after a sharp dip to 21% in FY22 under input cost and US pricing pressure, have recovered to over 25% by FY25 – reflecting a structural re-rating as companies shift toward complex generics, biosimilars, and higher-value export markets.
The sector's growing borrowings and capital intensity set it apart from capital-light industries. Generating enough operating cash flow to service debt while simultaneously funding pipeline investment is the central financial discipline challenge for pharma companies. Those that have managed this best – maintaining clean regulatory records, upgrading to complex products, and controlling working capital – have delivered the strongest five-year performance. That gap is unlikely to narrow.

