1. Executive Summary
India's IT sector has built one of the world's largest technology services industries over three decades, covering everything from large-scale software services and business process outsourcing to engineering R&D and enterprise software products. This benchmarking study tracks 30 leading companies across these segments, spanning both listed and unlisted entities, and covers five years of audited financial data from FY21 through FY25.
Combined revenues for the sample grew from ₹3,79,399 crore in FY21 to ₹6,13,894 crore in FY25, a four-year compound growth rate of approximately 12.8%. The sector's capital-light structure and strong cash generation are reflected in near-zero debt levels throughout the period, with total borrowings for all 30 companies amounting to just ₹7,647 crore in FY25.
Revenue and Profit Trends
- Sector revenues grew 61.8% in four years, with particularly strong momentum in FY22 and FY23 as global digital transformation spending accelerated post-pandemic.
- Operating profit expanded from ₹1,07,631 crore in FY21 to ₹1,46,386 crore in FY25, though operating margins compressed from 28.4% to 23.9% as companies absorbed elevated hiring and salary inflation costs during FY22 and FY23.
- Net profit grew consistently, rising from ₹80,331 crore in FY21 to ₹1,17,883 crore in FY25, with net margins recovering to approximately 19.2% in FY25 after a dip to 18.1% in FY23.
- The sector is structurally near-debt-free: total borrowings across all 30 companies peaked at ₹8,927 crore in FY22 and stood at ₹7,647 crore in FY25, with most companies carrying zero long-term debt.
- Networth strengthened from ₹2,96,955 crore to ₹3,54,762 crore, funded entirely by retained earnings rather than equity dilution.
- Total assets expanded from ₹4,08,679 crore to ₹5,35,135 crore, with current assets forming the dominant share throughout, a characteristic of services businesses that deploy capital through people and receivables rather than heavy fixed infrastructure.
- Margin moderation through FY23 to FY25 reflects the transition from pandemic-era cost control to a normalised operating environment, with higher bench ratios, fresher cohort absorption, and competitive wage cycles weighing on near-term profitability.
| Particulars (INR Cr.) | Mar-2021 | Mar-2022 | Mar-2023 | Mar-2024 | Mar-2025 |
|---|---|---|---|---|---|
| Sales | 3,79,398.5 | 4,51,846.7 | 5,50,684.9 | 5,76,549.4 | 6,13,894.4 |
| Operating profit | 1,07,631.2 | 1,19,751.0 | 1,32,122.0 | 1,37,444.4 | 1,46,386.1 |
| Net profit | 80,330.8 | 97,482.0 | 99,536.9 | 1,07,893.8 | 1,17,883.2 |
| Networth | 2,96,954.6 | 3,10,870.7 | 3,24,325.2 | 3,34,912.0 | 3,54,761.7 |
| Borrowings | 7,215.8 | 8,926.9 | 6,612.0 | 5,305.8 | 7,647.2 |
| Assets | 4,08,678.7 | 4,47,164.1 | 4,69,396.1 | 4,88,020.8 | 5,35,135.0 |
| Operating Margin | 28.37% | 26.50% | 23.99% | 23.84% | 23.85% |
| Net Margin | 21.17% | 21.57% | 18.08% | 18.71% | 19.20% |
2. Methodology
This study is based on five years of audited financial data for 30 leading IT companies in India, covering both listed and unlisted entities across IT services, engineering software, banking technology, BPO/ITeS, and software products. The objective was to evaluate sector-wide performance trends, profitability patterns, balance-sheet health, and efficiency metrics using standardised financial data and comparable benchmarks.
2.1 Data Sources
All financial data used in this study was sourced exclusively from Tofler.in, including:
- Profit & Loss Statements
- Balance Sheets
- Cash Flow Statements
- Financial Highlights
- Ratios & Margins
Only audited financials were considered for the analysis.
2.2 Company Selection
The study covers 30 companies representing the major segments of India's IT and technology services landscape. Companies were selected based on:
- Scale of operations (revenue and asset base)
- Representation across the IT value chain: large-cap exporters, mid-tier specialists, engineering services, banking software, and platform companies
- Mix of listed and unlisted entities to reflect the sector's true structure
- Subsector diversity: IT services, BPO/ITeS, engineering R&D, and software products
- Availability of consistent FY21 to FY25 audited financial data
Companies Used for Analysis:
These companies together represent the full range of India's technology services landscape, from large-cap offshore exporters and engineering R&D specialists to banking technology platforms and digital transformation firms, spanning both listed and unlisted players.
2.3 Scope of Analysis & Metrics Used
This study covers five years of audited financial data (FY21 to FY25) for 30 major IT companies, with the objective of assessing sector-wide growth, profitability patterns, balance-sheet health, and operational efficiency.
Key Metrics Analyzed:
- Growth Metrics: Sales CAGR, EBITDA CAGR (3-year, FY22 to FY25)
- Profitability Metrics: Gross Margin, Operating Margin, Net Margin, EBITDA, Net Profit
- Cost Structure: Employee Costs, Cost of Goods, Other Operating Costs
- Balance Sheet Metrics: Borrowings (short-term and long-term), Networth, Total Assets, Debt/Equity
- Efficiency Metrics: Asset Turnover, Days Receivable, Days Payable, Working Capital Days, Cash Conversion Cycle
Analytical Approach:
- Aggregating all 30 companies to compute sector-level totals and trends across FY21 to FY25
- Computing 3-year CAGRs (FY22 to FY25) for sales and EBITDA at the individual company level
- Benchmarking ratios using sector means and medians for realistic cross-company comparisons
- Analysing cash efficiency through cash conversion cycle and working capital day metrics
3. Industry Aggregates And Trends
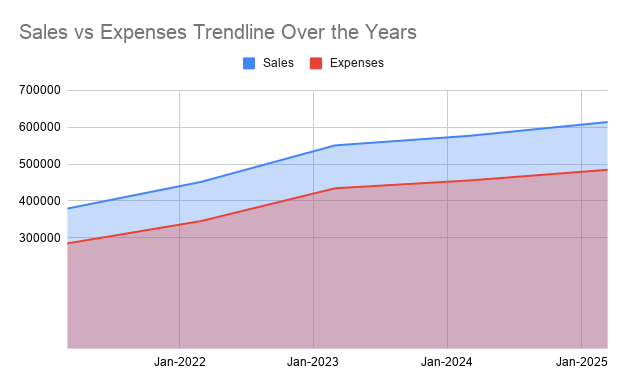
| Particulars (INR Cr.) | Mar-2021 | Mar-2022 | Mar-2023 | Mar-2024 | Mar-2025 |
|---|---|---|---|---|---|
| Sales | 3,79,398.5 | 4,51,846.7 | 5,50,684.9 | 5,76,549.4 | 6,13,894.4 |
| Expenses | 2,85,021.7 | 3,45,706.6 | 4,34,391.1 | 4,55,594.7 | 4,84,497.7 |
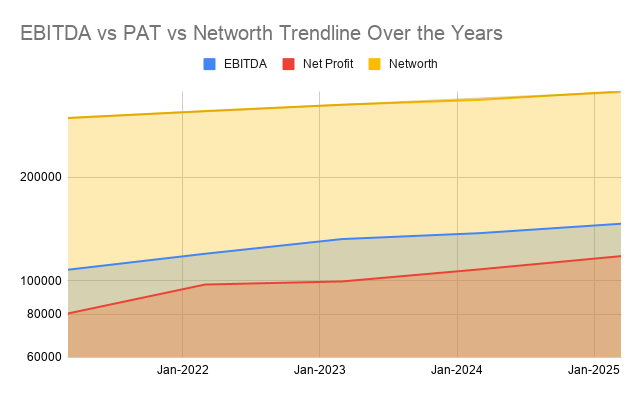
| Particulars (INR Cr.) | Mar-2021 | Mar-2022 | Mar-2023 | Mar-2024 | Mar-2025 |
|---|---|---|---|---|---|
| EBITDA | 1,07,631.2 | 1,19,751.0 | 1,32,122.0 | 1,37,444.4 | 1,46,386.1 |
| Net Profit | 80,330.8 | 97,482.0 | 99,536.9 | 1,07,893.8 | 1,17,883.2 |
| Networth | 2,96,954.6 | 3,10,870.7 | 3,24,325.2 | 3,34,912.0 | 3,54,761.7 |
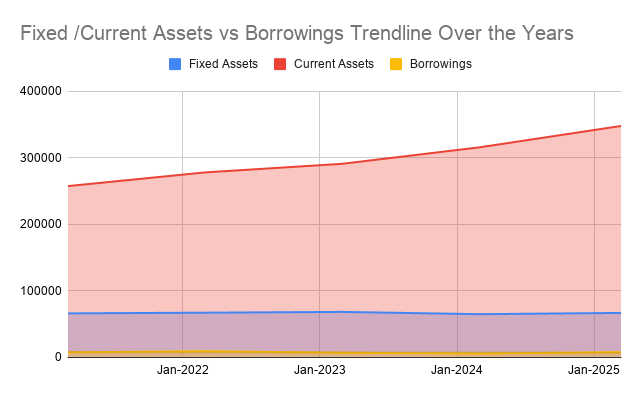
| Particulars (INR Cr.) | Mar-2021 | Mar-2022 | Mar-2023 | Mar-2024 | Mar-2025 |
|---|---|---|---|---|---|
| Fixed Assets | 65,884.5 | 66,887.6 | 68,078.6 | 64,638.0 | 66,566.6 |
| Current Assets | 2,57,365.3 | 2,77,957.0 | 2,90,895.9 | 3,15,714.8 | 3,47,888.7 |
| Borrowings | 7,215.8 | 8,926.9 | 6,612.0 | 5,305.8 | 7,647.2 |
4. Three Year Sales CAGR of the Companies
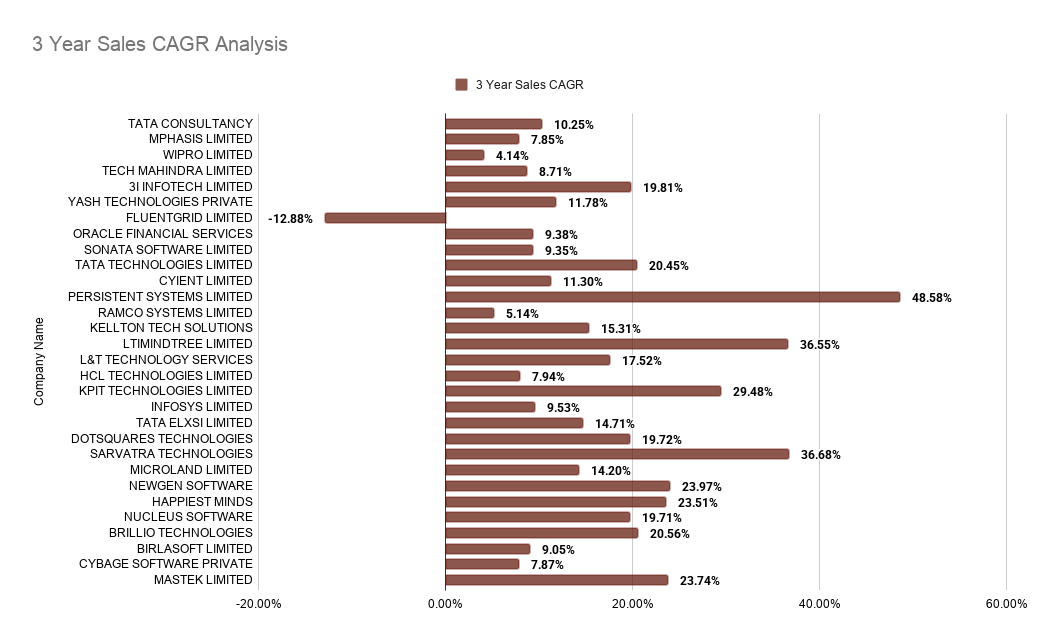
| Company Name | FY2022 (INR Cr.) | FY2025 (INR Cr.) | 3-Year Sales CAGR |
|---|---|---|---|
| PERSISTENT SYSTEMS LIMITED | 3,575.5 | 11,728.0 | 48.58% |
| SARVATRA TECHNOLOGIES PRIVATE LIMITED | 82.8 | 211.4 | 36.68% |
| LTIMINDTREE LIMITED | 14,406.4 | 36,682.5 | 36.55% |
| KPIT TECHNOLOGIES LIMITED | 1,181.0 | 2,563.9 | 29.48% |
| NEWGEN SOFTWARE TECHNOLOGIES LIMITED | 710.8 | 1,354.4 | 23.97% |
| MASTEK LIMITED | 256.7 | 486.3 | 23.74% |
| HAPPIEST MINDS TECHNOLOGIES LIMITED | 1,093.7 | 2,060.8 | 23.51% |
| BRILLIO TECHNOLOGIES PRIVATE LIMITED | 663.6 | 1,162.7 | 20.56% |
| TATA TECHNOLOGIES LIMITED | 1,730.8 | 3,024.5 | 20.45% |
| 3I INFOTECH LIMITED | 212.0 | 364.6 | 19.81% |
| DOTSQUARES TECHNOLOGIES INDIA PRIVATE LIMITED | 62.0 | 106.4 | 19.72% |
| NUCLEUS SOFTWARE EXPORTS LIMITED | 448.1 | 768.7 | 19.71% |
| L&T TECHNOLOGY SERVICES LIMITED | 5,873.7 | 9,533.1 | 17.52% |
| KELLTON TECH SOLUTIONS LIMITED | 123.2 | 188.9 | 15.31% |
| TATA ELXSI LIMITED | 2,470.8 | 3,729.0 | 14.71% |
| MICROLAND LIMITED | 1,019.0 | 1,517.7 | 14.20% |
| YASH TECHNOLOGIES PRIVATE LIMITED | 843.5 | 1,178.2 | 11.78% |
| CYIENT LIMITED | 1,750.5 | 2,413.6 | 11.30% |
| TATA CONSULTANCY SERVICES LIMITED | 1,60,341.0 | 2,14,853.0 | 10.25% |
| INFOSYS LIMITED | 1,03,940.0 | 1,36,592.0 | 9.53% |
| ORACLE FINANCIAL SERVICES SOFTWARE LIMITED | 3,896.1 | 5,099.1 | 9.38% |
| SONATA SOFTWARE LIMITED | 758.1 | 991.3 | 9.35% |
| BIRLASOFT LIMITED | 2,049.4 | 2,657.9 | 9.05% |
| TECH MAHINDRA LIMITED | 34,726.1 | 44,617.2 | 8.71% |
| HCL TECHNOLOGIES LIMITED | 40,638.0 | 51,105.0 | 7.94% |
| CYBAGE SOFTWARE PRIVATE LIMITED | 1,444.5 | 1,813.2 | 7.87% |
| MPHASIS LIMITED | 7,389.6 | 9,271.0 | 7.85% |
| RAMCO SYSTEMS LIMITED | 279.6 | 325.0 | 5.14% |
| WIPRO LIMITED | 59,574.4 | 67,292.8 | 4.14% |
| FLUENTGRID LIMITED | 305.8 | 202.2 | -12.88% |
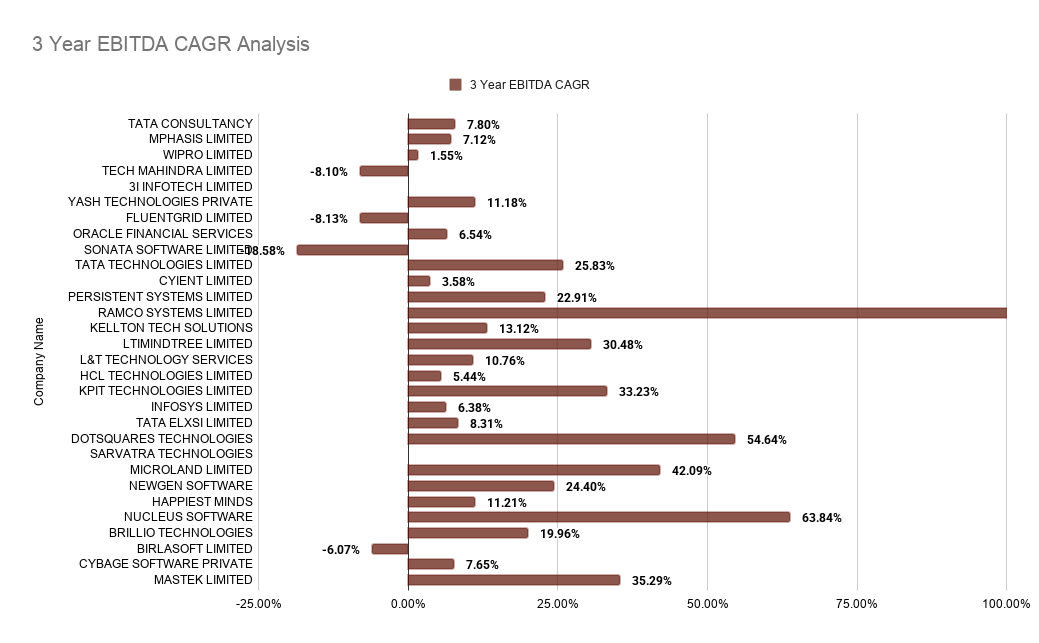
5. Three Year EBITDA CAGR of the Companies
| Company Name | FY2022 (INR Cr.) | FY2025 (INR Cr.) | 3-Year EBITDA CAGR |
|---|---|---|---|
| RAMCO SYSTEMS LIMITED | 5.8 | 87.4 | 147.00% |
| NUCLEUS SOFTWARE EXPORTS LIMITED | 36.4 | 160.1 | 63.84% |
| DOTSQUARES TECHNOLOGIES INDIA PRIVATE LIMITED | 4.3 | 15.9 | 54.64% |
| MICROLAND LIMITED | 115.7 | 331.9 | 42.09% |
| MASTEK LIMITED | 33.8 | 83.7 | 35.29% |
| KPIT TECHNOLOGIES LIMITED | 291.7 | 689.9 | 33.23% |
| LTIMINDTREE LIMITED | 2,777.5 | 6,169.9 | 30.48% |
| TATA TECHNOLOGIES LIMITED | 309.5 | 616.6 | 25.83% |
| NEWGEN SOFTWARE TECHNOLOGIES LIMITED | 181.1 | 348.6 | 24.40% |
| PERSISTENT SYSTEMS LIMITED | 870.2 | 1,615.9 | 22.91% |
| BRILLIO TECHNOLOGIES PRIVATE LIMITED | 89.2 | 154.0 | 19.96% |
| KELLTON TECH SOLUTIONS LIMITED | 22.8 | 33.0 | 13.12% |
| HAPPIEST MINDS TECHNOLOGIES LIMITED | 257.7 | 354.4 | 11.21% |
| YASH TECHNOLOGIES PRIVATE LIMITED | 86.6 | 119.0 | 11.18% |
| L&T TECHNOLOGY SERVICES LIMITED | 1,319.1 | 1,792.4 | 10.76% |
| TATA ELXSI LIMITED | 765.7 | 972.9 | 8.31% |
| TATA CONSULTANCY SERVICES LIMITED | 46,245.0 | 57,929.0 | 7.80% |
| CYBAGE SOFTWARE PRIVATE LIMITED | 499.1 | 622.6 | 7.65% |
| MPHASIS LIMITED | 1,705.1 | 2,095.8 | 7.12% |
| ORACLE FINANCIAL SERVICES SOFTWARE LIMITED | 2,191.3 | 2,650.2 | 6.54% |
| INFOSYS LIMITED | 27,828.0 | 33,499.0 | 6.38% |
| HCL TECHNOLOGIES LIMITED | 15,112.0 | 17,716.0 | 5.44% |
| CYIENT LIMITED | 512.8 | 569.9 | 3.58% |
| WIPRO LIMITED | 12,411.2 | 12,998.3 | 1.55% |
| BIRLASOFT LIMITED | 401.9 | 333.1 | -6.07% |
| TECH MAHINDRA LIMITED | 5,485.3 | 4,258.0 | -8.10% |
| FLUENTGRID LIMITED | 61.0 | 47.3 | -8.13% |
| SONATA SOFTWARE LIMITED | 142.3 | 76.8 | -18.58% |
| 3I INFOTECH LIMITED | -3.8 | 8.9 | NA |
| SARVATRA TECHNOLOGIES PRIVATE LIMITED | -7.3 | 35.6 | NA |
6. Cash Efficiency Comparison Between Companies
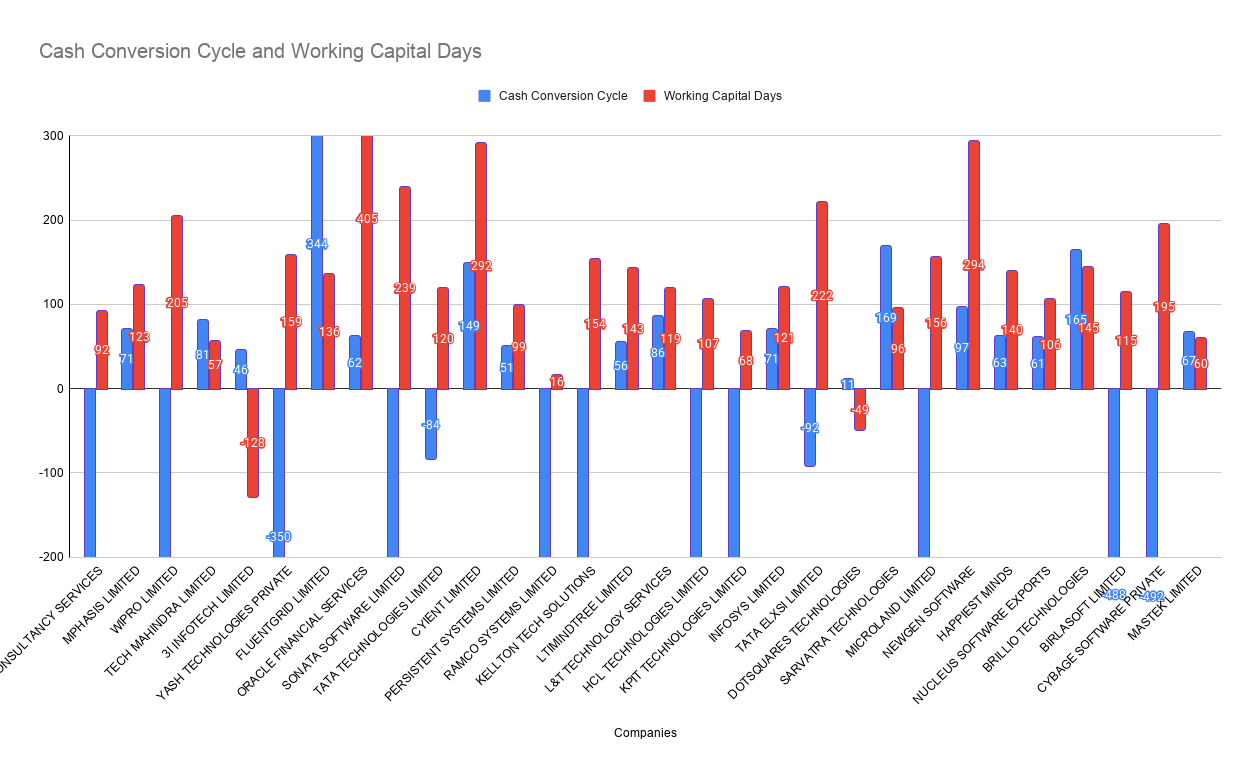
| Company Name | Cash Conversion Cycle (Days) | Working Capital Days |
|---|---|---|
| FLUENTGRID LIMITED | 344 | 136 |
| SARVATRA TECHNOLOGIES PRIVATE LIMITED | 169 | 96 |
| BRILLIO TECHNOLOGIES PRIVATE LIMITED | 165 | 145 |
| CYIENT LIMITED | 149 | 292 |
| NEWGEN SOFTWARE TECHNOLOGIES LIMITED | 97 | 294 |
| L&T TECHNOLOGY SERVICES LIMITED | 86 | 119 |
| TECH MAHINDRA LIMITED | 81 | 57 |
| MPHASIS LIMITED | 71 | 123 |
| INFOSYS LIMITED | 71 | 121 |
| MASTEK LIMITED | 67 | 60 |
| HAPPIEST MINDS TECHNOLOGIES LIMITED | 63 | 140 |
| ORACLE FINANCIAL SERVICES SOFTWARE LIMITED | 62 | 405 |
| NUCLEUS SOFTWARE EXPORTS LIMITED | 61 | 106 |
| LTIMINDTREE LIMITED | 56 | 143 |
| PERSISTENT SYSTEMS LIMITED | 51 | 99 |
| 3I INFOTECH LIMITED | 46 | -128 |
| DOTSQUARES TECHNOLOGIES INDIA PRIVATE LIMITED | 11 | -49 |
| TATA TECHNOLOGIES LIMITED | -84 | 120 |
| TATA ELXSI LIMITED | -92 | 222 |
| YASH TECHNOLOGIES PRIVATE LIMITED | -350 | 159 |
| BIRLASOFT LIMITED | -488 | 115 |
| CYBAGE SOFTWARE PRIVATE LIMITED | -492 | 195 |
| MICROLAND LIMITED | -9,010 | 156 |
| HCL TECHNOLOGIES LIMITED | -9,547 | 107 |
| SONATA SOFTWARE LIMITED | -11,022 | 239 |
| WIPRO LIMITED | -11,164 | 205 |
| KELLTON TECH SOLUTIONS LIMITED | -24,324 | 154 |
| KPIT TECHNOLOGIES LIMITED | -46,686 | 68 |
| RAMCO SYSTEMS LIMITED | -1,06,998 | 16 |
| TATA CONSULTANCY SERVICES LIMITED | -1,32,704 | 92 |
Note on Negative Cash Conversion Cycle: A negative CCC, as seen with companies like TCS, Infosys, and Wipro, is actually a competitive strength. It means these companies collect payments from clients before they need to pay their own vendors and employees. In the IT services industry, this is common among large players with strong brand equity and pricing power, who can negotiate favourable advance payment terms. Effectively, the business runs on its clients' money, freeing up internal capital for investment and growth.
7. Financial Ratios And Benchmarks
The tables below present sector-wide benchmarks across key financial ratios for FY25, computed as the mean and median across all 30 companies, alongside the minimum and maximum observed values. These serve as reference points for evaluating individual company performance relative to the broader IT sector.
7.1 Solvency
| Ratio | Mean | Median | Min | Max |
|---|---|---|---|---|
| Total Debt / Equity | 0.10 | 0.00 | 0.00 | 0.70 |
| Net Debt / Equity | 0.08 | 0.00 | 0.00 | 0.70 |
| Total Debt / Assets | 0.05 | 0.00 | 0.00 | 0.30 |
| Total Assets / Equity | 1.53 | 1.40 | 1.10 | 3.20 |
7.2 Liquidity
| Ratio | Mean | Median | Min | Max |
|---|---|---|---|---|
| Current Ratio | 3.30 | 2.30 | 0.40 | 11.80 |
| Quick Ratio | 3.29 | 2.30 | 0.40 | 11.80 |
| Interest Coverage | 119.08 | 31.55 | 1.30 | 2,038.60 |
7.3 Performance
| Ratio | Mean | Median | Min | Max |
|---|---|---|---|---|
| Gross Margin | 98.44% | 100.00% | 77.30% | 100.00% |
| Operating Margin | 20.62% | 19.85% | 2.40% | 52.00% |
| Net Margin | 16.85% | 15.70% | -3.10% | 49.10% |
7.4 Return
| Ratio | Mean | Median | Min | Max |
|---|---|---|---|---|
| Return on Equity (ROE) | 24.42% | 22.70% | -1.30% | 63.50% |
| Pre-tax ROCE | 30.74% | 32.35% | -68.60% | 83.20% |
| Return on Assets (ROA) | 16.35% | 15.25% | -1.10% | 40.20% |
| Pre-tax ROIC | 22.10% | 20.60% | -9.20% | 71.00% |
7.5 Efficiency
| Ratio | Mean | Median | Min | Max |
|---|---|---|---|---|
| Days Receivable | 90.40 days | 71.00 days | 11 days | 344 days |
| Fixed Asset Turnover | 10.45 | 7.45 | 0.90 | 43.30 |
| Total Asset Turnover | 0.97 | 1.00 | 0.30 | 2.10 |
| Working Capital Days | 133.57 days | 122 days | -128 days | 405 days |
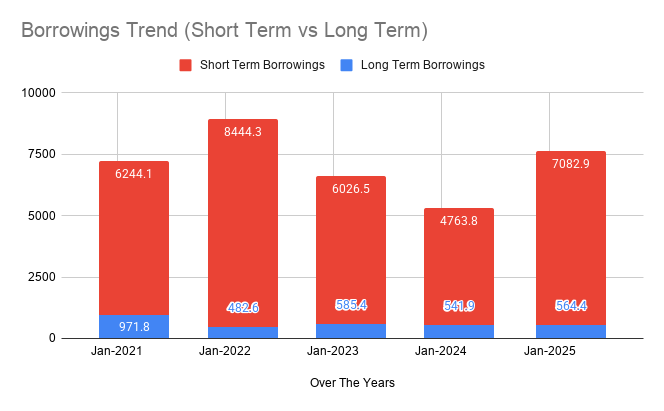
8. Borrowings Trend (Short Term vs Long Term)
| Particulars (INR Cr.) | Mar-2021 | Mar-2022 | Mar-2023 | Mar-2024 | Mar-2025 |
|---|---|---|---|---|---|
| Short Term Borrowings | 6,244.1 | 8,444.3 | 6,026.5 | 4,763.8 | 7,082.9 |
| Long Term Borrowings | 971.8 | 482.6 | 585.4 | 541.9 | 564.4 |
| Borrowings | 7,215.8 | 8,926.9 | 6,612.0 | 5,305.8 | 7,647.2 |
9. Top 3 Companies by Metrics (As of March 2025)
9.1 Top 3 Companies by Net Margin
| Company Name | Sales (INR Cr.) | Net Profit (INR Cr.) | Net Margin (%) |
|---|---|---|---|
| ORACLE FINANCIAL SERVICES SOFTWARE LIMITED | 5,099.1 | 3,350.7 | 49.1% |
| CYIENT LIMITED | 2,413.6 | 1,124.6 | 45.1% |
| CYBAGE SOFTWARE PRIVATE LIMITED | 1,813.2 | 958.5 | 38.3% |
9.2 Top 3 Companies by Sales
| Company Name | Sales (INR Cr.) | Net Profit (INR Cr.) | EBITDA (INR Cr.) |
|---|---|---|---|
| TATA CONSULTANCY SERVICES LIMITED | 2,14,853.0 | 48,057.0 | 57,929.0 |
| INFOSYS LIMITED | 1,36,592.0 | 25,568.0 | 33,499.0 |
| WIPRO LIMITED | 67,292.8 | 10,792.4 | 12,998.3 |
9.3 Top 3 Companies by Borrowings
| Company Name | Sales (INR Cr.) | Net Profit (INR Cr.) | Borrowings (INR Cr.) |
|---|---|---|---|
| WIPRO LIMITED | 67,292.8 | 10,792.4 | 6,050.0 |
| HAPPIEST MINDS TECHNOLOGIES LIMITED | 2,060.8 | 184.7 | 1,160.9 |
| YASH TECHNOLOGIES PRIVATE LIMITED | 1,178.2 | 72.0 | 143.6 |
10. Industry Context & Market Landscape
10.1 Market Landscape (National View)
India's IT sector has grown from a niche export business in the 1990s into one of the country's defining economic pillars – among the largest contributors to GDP, its biggest source of foreign exchange, and one of the largest formal employment generators in the country.
Growth moderated in FY24 and FY25 after the post-pandemic highs of FY22–FY23, as clients in North America and Europe pulled back on discretionary technology spending. Sector revenues for the 30 companies tracked here grew from ₹3,79,399 crore in FY21 to ₹6,13,894 crore in FY25 – a four-year expansion of over 60%. Operating margins narrowed from 28.4% to 23.9% over the same period, reflecting wage inflation absorbed during the FY22–FY23 hiring surge.
- Export dominance: North America is the primary revenue market, with BFSI as the largest vertical. Europe is the second-largest geography.
- Capital-light structure: Total borrowings across all 30 companies stood at just ₹7,647 crore in FY25, with most companies carrying negligible or zero long-term debt.
- Employment engine: The sector provides one of the largest pools of formal, salaried employment in India, spanning tier-1 cities and, increasingly, tier-2 towns.
- AI transition underway: The shift from labour-arbitrage delivery to value-added, outcome-oriented services is reshaping hiring patterns, pricing models, and margin structures across the sector.
10.2 Regional Distribution
Tier-1 IT Hubs
- Established clusters – Bengaluru, Hyderabad, Pune, Chennai, Delhi-NCR, and Mumbai – host the large majority of GCC operations and large-scale IT services delivery.
- Bengaluru remains the dominant technology hub, with the highest concentration of GCCs, R&D labs, and AI delivery centres in the country.
- Hyderabad has grown rapidly as a tier-1 hub with notable strength in BFSI and cloud services delivery.
- Chennai anchors embedded software and automotive R&D, with strong linkages to manufacturing and semiconductor clients.
Tier-2 and Emerging Hubs
- Cities like Coimbatore, Jaipur, Nagpur, and Indore are recording materially faster hiring growth than established metros.
- Significantly lower talent costs and real estate make these cities attractive for cost-disciplined delivery expansion.
- Government-backed IT parks and infrastructure incentives are accelerating new centre openings across these cities.
11. Industry Structure And Business Model
India's IT industry operates through four primary segments serving different parts of the global technology delivery chain. The offshore model – pairing cost-competitive Indian talent with client-facing onshore teams – remains the structural backbone, evolving from pure cost arbitrage toward platform-based delivery and outcome-based contracts.
11.1 Industry Structure Overview
| Segment | Role / Examples | Core Strengths | Limitations |
|---|---|---|---|
| IT Services Companies | Application development, managed services, infrastructure, testing, consulting for global clients | Deep client relationships, multi-vertical expertise, large talent pool, scale delivery | Commoditisation pressure in legacy services; pricing compression as automation rises |
| BPO / ITeS Companies | Finance and accounting, customer support, HR operations, KPO, data annotation | Cost efficiency at scale; recurring revenue; strong process depth in regulated verticals | High headcount intensity; vulnerable to automation of routine process work |
| Global Capability Centers (GCCs) | Wholly owned offshore units of multinationals delivering R&D, engineering, AI, and corporate functions | High-value work with direct parent mandate; stronger margin retention; faster decision cycles | Intense talent competition with large IT services firms; complex cross-timezone governance |
| Software Product & SaaS Companies | Proprietary software sold on licence or subscription; India-built products competing in global markets | High margins, recurring revenue, global scalability without proportional headcount growth | Require sustained R&D investment; compete against deep-pocketed global product companies |
11.2 Value Chain and Delivery Model
The IT services value chain runs from client engagement onshore → solution design → offshore development and testing → QA and deployment → managed services. The offshore leverage ratio is the primary margin driver – firms with a higher share of offshore delivery consistently achieve better operating margins, reflected in the wide range across this sample from 2.4% to 52.0%.
The model has evolved from pure offshore to a hybrid: onshore teams handle client proximity, while offshore teams execute development and run-and-maintain work. Leading firms now blend offshore efficiency with local agility across multiple delivery geographies.
11.3 Margin Pools by Service Type
- Legacy application maintenance and support: Large in volume, lowest in margin. Under increasing pressure from automation tooling and productivity-linked pricing.
- Application development and testing: Mid-range margin. Shifting toward platform-based delivery to improve cycle times and reuse.
- Digital and cloud transformation: Higher margin; strong deal flow from enterprise cloud migration across BFSI, retail, and manufacturing.
- Engineering R&D and embedded software: Premium margins; harder to commoditise; high demand from GCCs, semiconductor, and automotive clients.
- AI and GenAI-integrated services: Fastest-growing pool; outcome-priced; highest margin upside but still a small share of total revenue.
12. Innovation And Upcoming Business Models
12.1 GenAI-native Delivery and Agentic AI
India's IT sector is moving from AI-assisted delivery to AI-native delivery. GenAI tools are being embedded into software development pipelines, automated testing, and customer support. Agentic AI – autonomous systems executing multi-step workflows with limited human intervention – is being piloted in finance automation, code generation, infrastructure monitoring, and document processing.
Hybrid teams of engineers working alongside AI agents are expanding throughput without proportional headcount growth. This puts pressure on the traditional pyramid model but opens better margin profiles for firms that manage the transition well.
12.2 Platform Engineering and Outcome-Based Contracts
The shift from time-and-materials billing to outcome-priced contracts is one of the most significant structural changes underway. Clients increasingly pay for delivered outputs – a working module, a measurable reduction in incident volume – rather than person-hours. Platform engineering, where reusable components are assembled rather than built from scratch, compresses timelines and shifts the margin equation toward software-defined value.
12.3 GCCs Evolving into Innovation Centres
India hosts one of the world's largest concentrations of GCCs, and their mandate is changing fast. These centres are progressively taking on product ownership, AI centre of excellence mandates, and end-to-end engineering responsibilities that previously sat at parent company HQs. The shift from execution to ownership is the defining trend in this segment, creating sustained demand for talent, real estate, and IT services support.
12.4 India-Built Software Product Companies
India's software product segment is producing globally competitive companies. Several mid-size companies in our sample – particularly those in banking software and enterprise automation – are growing well above the sector average, as seen in the 3-year Sales CAGR data in Section 4. The broader shift is clear: India is increasingly an origination point for enterprise software, not only a delivery location.
13. Policy, Schemes & Recent Developments
13.1 IndiaAI Mission
The IndiaAI Mission is deploying computing infrastructure through public-private partnerships and funding indigenous AI foundational model development. GPU availability under the mission is being expanded in phases, with a focus on making compute accessible to academic institutions and startups alongside large enterprises. This is directly relevant as demand for AI-integrated IT delivery accelerates.
13.2 STPI, SEZs, and PLI
Software Technology Parks of India (STPI) provide export-oriented status, tax benefits, and shared infrastructure – particularly valuable for small and mid-size IT exporters. Special Economic Zones offer additional duty exemptions and simplified compliance. PLI schemes for IT hardware aim to reduce India's dependence on imported server and networking infrastructure.
13.3 Digital Personal Data Protection (DPDP) Act
The DPDP Act, notified in late 2025, introduces: contractual liability for data processors handling global client data, cross-border data transfer restrictions that may affect offshore delivery models, and compliance requirements falling more heavily on smaller BPO and data-handling firms. The compliance gap across the industry is likely to drive near-term demand for privacy readiness services.
13.4 Digital India and Broader Policy Framework
India's public digital infrastructure – UPI, Account Aggregator, ONDC, DigiLocker – continues to create platform-level opportunities for IT companies. The IndiaStack ecosystem is a structural differentiator that global technology firms increasingly seek access to, and its continued expansion underpins domestic IT services demand.
14. Sector Challenges & Risks
| Challenge | Impact on the Sector | Who is Most Affected |
|---|---|---|
| US immigration policy and visa constraints | Tightening of work visa availability and rising salary thresholds are constraining onshore delivery capacity and increasing client-proximity costs for Indian IT firms in North America. | Large IT services firms with high North America revenue dependence and significant onshore delivery teams. |
| AI disruption to the headcount-led growth model | GenAI tools are compressing person-hours per project. Outcome-based pricing reduces topline revenue per engagement even as productivity improves. The traditional pyramid model is under structural pressure. | Tier-1 IT services firms and BPOs with large entry-level workforces and high run-the-business revenue mix. |
| Talent attrition and AI reskilling gap | Roles in AI, cloud architecture, and cybersecurity see elevated churn. The skills gap is widening faster than training programmes can close it, creating delivery risk and wage inflation in niche profiles. | All IT segments; most acute for mid-tier firms that cannot match compensation of large IT firms and hyperscalers. |
| Currency risk on margins | Revenue is foreign-currency-denominated while costs are predominantly INR-based. Rupee appreciation erodes margins and is difficult to fully hedge – a key factor in the operating margin compression from FY21 to FY25. | Large pure-play exporters, including TCS, Infosys, Wipro, and HCL Technologies. |
| DPDP compliance and data localisation uncertainty | Evolving data protection rules create compliance costs and delivery model uncertainty. Tighter cross-border data flow restrictions could require restructuring of offshore pipelines for clients in regulated sectors. | BPO and ITeS firms with global data-handling mandates; IT services companies serving BFSI and healthcare clients. |
| Pricing pressure in legacy services | Application maintenance, helpdesk, and routine testing face structural pricing compression as AI-assisted coding and hyperscaler tooling reduce the value of traditional labour-intensive delivery. | Companies with a high share of application management services, especially mid-tier IT services. |
| Revenue concentration in North America | A high share of IT export revenues comes from North American clients. Any macro slowdown or trade friction amplifies earnings impact on firms with limited geographic diversification. | Broad-based IT services exporters; smaller firms without meaningful Europe or Asia-Pacific revenue. |
15. Opportunities & Future Outlook
15.1 Growth Areas
- GCC expansion: India's GCC ecosystem continues to grow rapidly, with new formations accelerating across BFSI, technology, retail, and manufacturing – including from mid-market global companies setting up India centres for the first time. This creates sustained demand for build-operate-transfer services, talent, and IT infrastructure.
- AI infrastructure: Large hyperscalers and domestic players are investing significantly in Indian data centre capacity, building the compute substrate for AI-native delivery at scale. IT companies with data centre management and cloud services capabilities stand to benefit.
- Engineering R&D and embedded software: Automotive electrification, industrial automation, semiconductor design, and connected devices are driving strong demand for embedded software. Companies like KPIT Technologies and Tata Elxsi have recorded among the highest Sales CAGRs in this study's sample.
- Domestic IT spending: BFSI digitisation, government technology programmes, and retail modernisation are growing above the sector's export headline – a second growth engine that reduces dependence on North American client budgets.
15.2 Strategic Priorities
- Build AI-augmented delivery: Firms demonstrating measurable AI-driven productivity gains are winning larger transformation mandates. This is now a near-term competitive requirement, not a longer-term option.
- Move toward products and platforms: Services companies building proprietary platforms capture higher and more stable margins than pure services delivery, while reducing earnings volatility tied to client budget cycles.
- Expand tier-2 delivery: Lower-cost talent in Coimbatore, Jaipur, Nagpur, and Indore reduces delivery cost and attrition relative to saturated metro markets, de-risking over-concentration in Bengaluru and Hyderabad.
- GCC advisory and build-operate-transfer: Helping new GCC entrants set up and transition to self-managed operations is a growing professional services line with strong downstream attachment for managed services and staffing.
16. Conclusion
The data in this report tells a clear story. Across 30 companies and five years, combined revenues grew from ₹3,79,399 crore to ₹6,13,894 crore, net profit expanded from ₹80,331 crore to ₹1,17,883 crore, and total borrowings across the entire sample remained below ₹9,000 crore throughout. This is a sector with strong underlying economics: high margins, near-zero leverage, and cash generation that funds growth without dilution.
The structural challenges are real. Margin compression, the shift to outcome-based pricing, AI pressure on traditional revenue models, and visa constraints will all shape the next phase of sector growth. But the companies navigating these well – as evidenced by the wide CAGR and margin spread across this sample – are doing so through specialisation, platform investment, and early AI-integrated delivery.
The sector's capital-light model, talent depth, and cost position remain structural advantages that are difficult to replicate. The question for each company is not whether the market opportunity is there – it is whether the business model is positioned to capture it profitably.

