
The previous article in the Financial Statement Analysis Series gave an introduction to the financial analysis and mentioned the various statements for analysis and the various users who would be interested in the same. In this article, we will take a look at the various tools and techniques used for doing the analysis. The articles to follow will focus on an elaborate discussion of the various financial statements and will further take up each tool and technique separately and explain them in detail as well.
Financial Statement Analysis is done in different ways using various tools and techniques. As discussed in the previous article, there are different users of financial analysis and they may be interested in some tools and techniques and uninterested in the others.
The various tools and techniques available for financial statement are mentioned below.
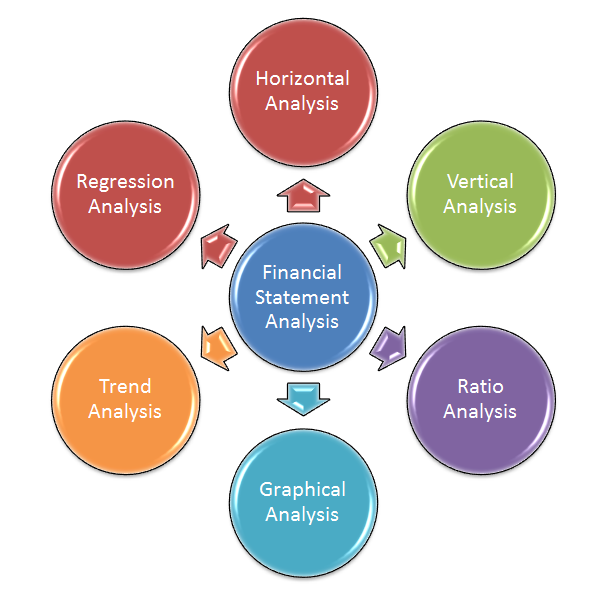
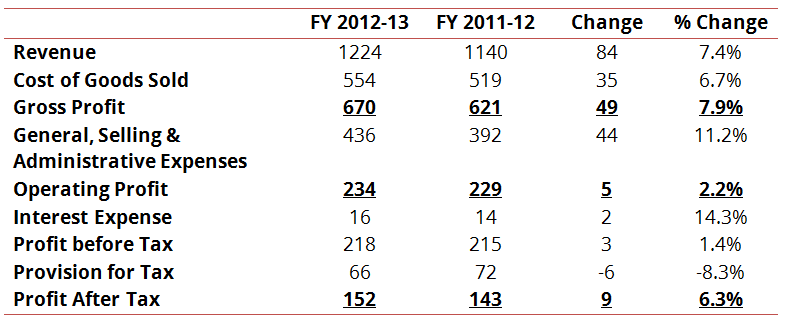
1. Comparative Financial Statement Analysis (Horizontal Analysis): As the name suggests, comparative analysis provides a year-on-year review of the various financial statements. For example, in the Income Statement, the Sales figure may be compared over a period of consecutive years to understand how the sales figures have grown (or declined) over the year. It should be noted that horizontal analysis compares the internal performance of the company.
Below is an example of a Comparative Income Statement.
Comparative Income Statement (All figures are in INR ‘000)
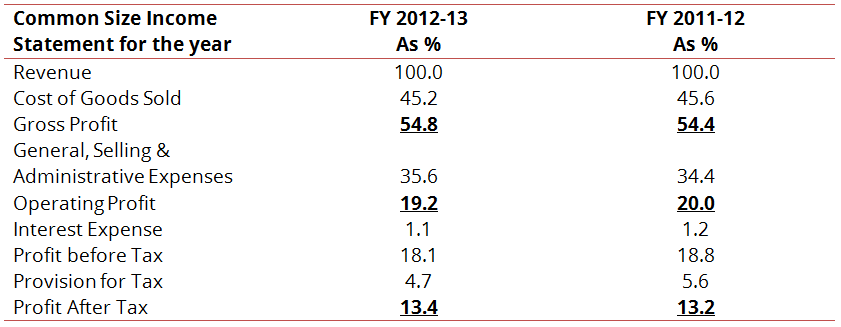
2. Common-size Financial Statement Analysis (Vertical Analysis): Vertical analysis is applicable for internal performance review as well as for comparison to peers and bench-marking. In vertical analysis all the items in a particular statement are represented as a percentage of a particular item. For example, Operating Expenses, Depreciation, Amortization, Profit before tax, Tax, Profit after tax, etc. may be represented as a percentage of Sales in the Income Statement. Common standard base can easily reveal the internal make-up of financial statements and any proportionate increase and decrease of the same.
Vertical analysis is also put to use for comparison across companies as financial statements are converted to common-size format, which can then be used to compare with competitor or industry averages, highlighting key differences which can then be analyzed.
Below is an example of a Common Size Income Statement. Values are expressed as %age of Revenue.
3. Ratio Analysis: Ratio analysis is the most widely used tool of financial statement analysis. A ratio gives relationship between two numbers, in this case items in the financial statements. Ratios are popular because they readily allow internal evaluation as well as comparison across firms. The ratios are categorized according to activities or functions they perform or the information they provide. For example, profitability ratios measure the profit making capability of the company.
4. Graphical Analysis: Graphs provide visual representation of the performance that can be easily compared over time. The graphs may be line graphs, column graphs or pie charts.
5. Trend Analysis: Trend analysis is used to reveal the trend of items with the passage of time and is generally used as a statistical tool. Trend analysis is used in conjunction with ratio analysis, horizontal and vertical analysis to spot a particular trend, explore the causes of the same and if required prepare future projections.
6. Regression Analysis: Regression analysis is a statistical tool used to establish and estimate relationship among variables. Generally, the dependent variable is related to one or more independent variables. In case of financial statement analysis, the dependent variable may be, say, sales, and it is required to estimate its relationship with the independent variable, say, a macroeconomic factor like Gross Domestic Product.
For example, in the Top Down approach of sales forecasting, an analyst would first forecast GDP growth and then establish a relationship between GDP and industry growth rate through regression analysis. He may then estimate the future sales growth based on the industry growth. As such, regression analysis is widely used in forecasting models.
The various tools and techniques are there to enable the decision making. It should be understood that any particular technique should not be viewed in isolation. Different companies may have different accounting methods and hence, comparison with peers has to be done carefully. Moreover, a holistic use of various techniques should be done to arrive at any conclusion.
Having understood how to do financial analysis, we need to further delve into the financial statements that are used to prepare this analysis. In the next article, we will take a look at the various financial statements that are used for the purpose of Financial Statement Analysis.
Author – Vishal, a recent addition to Team Tofler, combines his passion of writing with searching for a worthy story in a Company, to make an interesting read.
Editor – Anchal, founder at Tofler, is a CA, CS and has more than 5 years experience in company analysis. She likes to explore and track companies, their performance and senior management.
To know more details of companies, the major stakeholders, their network, the revenue of the companies, and many more important details. Explore the subscription plans available with us. Click here.