
In this article in the Financial Statement Analysis Series, we will discuss the first basic method of analysis, the Year-on-Year Analysis and use them to better understand a sample Balance Sheet and Profit and Loss Statement.

The Year-on-Year Analysis is also known as Horizontal Analysis or Comparative Analysis. In this we compare the values under the various heads with the corresponding value of previous years. Effectively, it is a year-on-year change analysis. The differential values are expressed in amounts as well as in percentages. The amounts and the percentages help to ensure that overemphasis is not laid on a large change in a small value, for example a 80% change in INR 1,000 is less significant than a 10% change in INR 20,000.
The year-on-year analysis is simplistic in its approach and can be done easily. Say, there is a 10% dip in the profit of the company. The user of the statement can then investigate the various heads occurring in the P&L Statement to arrive at a reason for the same- the cost of producing goods might have gone up, the interest cost might have increased due to additional borrowings, etc. Further analysis about the company’s health, asset quality, borrowings, etc. can be drawn from this initial conclusion and this is where the Comparative Statement serves its purpose.
Explanation
In the Balance sheet, the FY 2013-14 values are taken as the Base. For example, in the Share Capital row, the base value will be INR 26,35,00,000.
The Increase or Decrease in Amount is calculated as:
Change in Value = Current Year Value – Base Year Value
Current Year being FY 2014-15
The percentage changes are calculated as
%age Change= [(Current Value- Base Value)/Base value] * 100
Given below is a sample Horizontal analysis for a company ABC Private Limited.
Horizontal Analysis of Balance Sheet
all figures are in INR ‘000
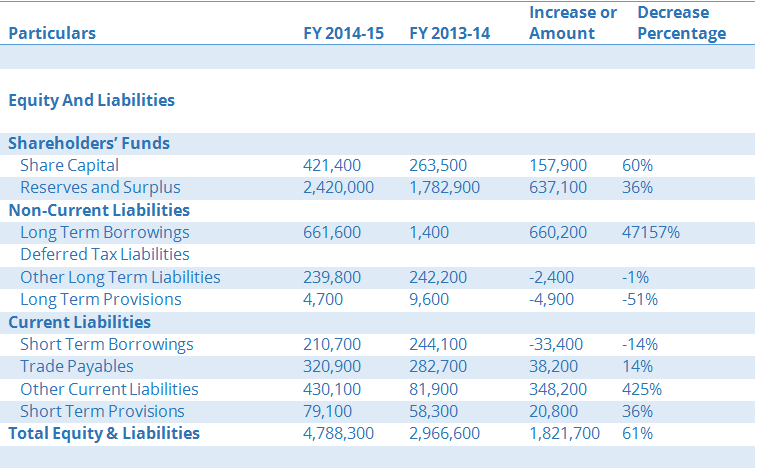
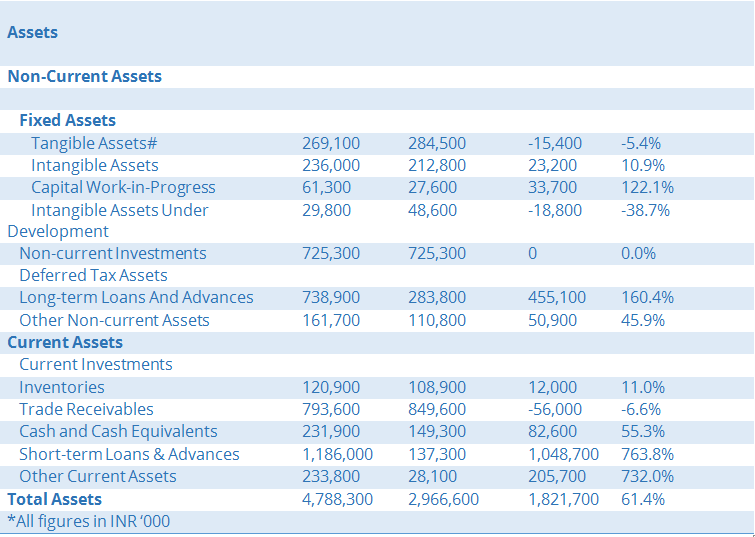
Observations
The Total Equity and Liabilities have gone up by 61% and, correspondingly, the Total Assets have also increased. The company has taken INR 66 Crores of Long-Term Loans, which is a significant rise over the previous similar borrowings of INR 14 lacs. The next question arises- what is this money being put use to? The company’s Loans and Advances (both Short-term and Long-Term) have increased drastically to INR 150 Crores in this period. The reason for the same needs to be checked. Similar analysis can be applied to other heads.
Horizontal Analysis of Profit and Loss Statement
All figures in INR ‘000.
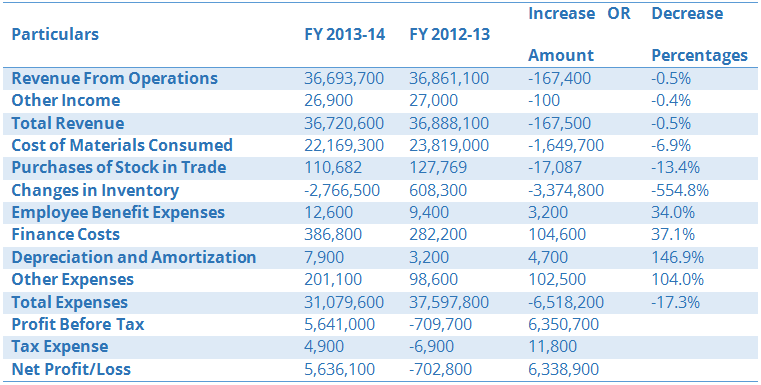
Observations
There is no growth in the revenue of the company and this should serve as a trigger to the management as well to the investors to find the underlying reasons for the same.
The Net Profit of the company, however, has increased substantially by INR 633 Crores compared to a loss of INR 70 Crores in the previous year. Again a trigger for exploring how the Profit has increased despite the Revenue figures going down.
Another observation is that the Cost of Material Consumed has reduced. Is it due to a fall in the price of the raw materials consumed or some other reason?
All these questions need further probing of the other Financial Statements, Schedules and Notes.
The Year-on-year analysis is often the first step in finding the areas for investigation. A lot of these questions can be answered by Ratio Analysis, Trend Analysis, Management’s Discussion, etc.
Some Key Notes
In the analysis it may happen that the base value is negative and, hence, the percentage comes out to be negative, whereas the changes are positive- the Gross Profit might have increased from INR -20,000 to INR 60,000, the actual rise in Gross Profit is INR 80,000 but the percentage change may show as -400%, which clearly does not reflect the correct picture.
If the value in the Base Year is 0 then change in % age cannot be calculated. Also, if the value in the Base Year is very small in comparison to the next year, the %age change might come out to be abnormally high. The users need to keep these points in mind while doing the analysis
Conclusion
The horizontal analysis is straight forward, easy to do and can be successfully used to compare performance over the years. Further, a sudden change in values can be observed and an investigation in their reasons be done. It is therefore, a very powerful tool in the analysis of Financial Statements.
Next in the series we will take a look at the Vertical Analysis of Financial Statements.
Author– Vishal, a Sci-fi enthusiast, engineer by mistake and writer by choice, combines his eye for numbers with natural storytelling to churn out Tofler’s blogs.
Editor – Anchal, founder at Tofler, is a CA, CS and has more than 5 years experience in company analysis. She likes to explore and track companies, their performance and senior management.