
The PE ratio (price-to-earnings ratio) of a company is a metric that compares the market price of a stock to its earnings per share. It is helpful to understand how the index is positioned, whether it is overvalued or undervalued.
Eventually, the P/E ratio of a company tells the amount of money an investor is willing to pay for one rupee of the company’s earnings.
The Nifty 50 P/E ratio has averaged around 20. Any value above 25 indicates that the index is costly. When the index is above 25; the market may be headed for a correction. If the P/E ratio of Nifty 50 is below 15; the index is undervalued and a bounce back is expected shortly.
So, knowing the P/E ratio could be a good strategy for an intelligent investor to analyse a suitable time to entre or exit the market using
Calculating Nifty 50 P/E ratio:
Nifty 50 index is made by top 50 companies of India. To calculate the P/E ratio of the Nifty 50 index, you need to take the sum of market capitalisation of all 50 companies and divide it by the sum of their profit after tax. This will give you the P/E ratio of the index.
The Nifty 50 P/E ratio is a metric used to understand the value of the Nifty 50 index. It is almost equivalent to calculating the P/E ratio of a company, but it tells the health of the entire index, instead of individual companies.
To understand how the individual company is performing; you can compare the P/E ratio of individual companies to the Nifty 50 P/E ratio.
Here is the NIFTY Price-Earnings Ratio from year 2020 to 2022.
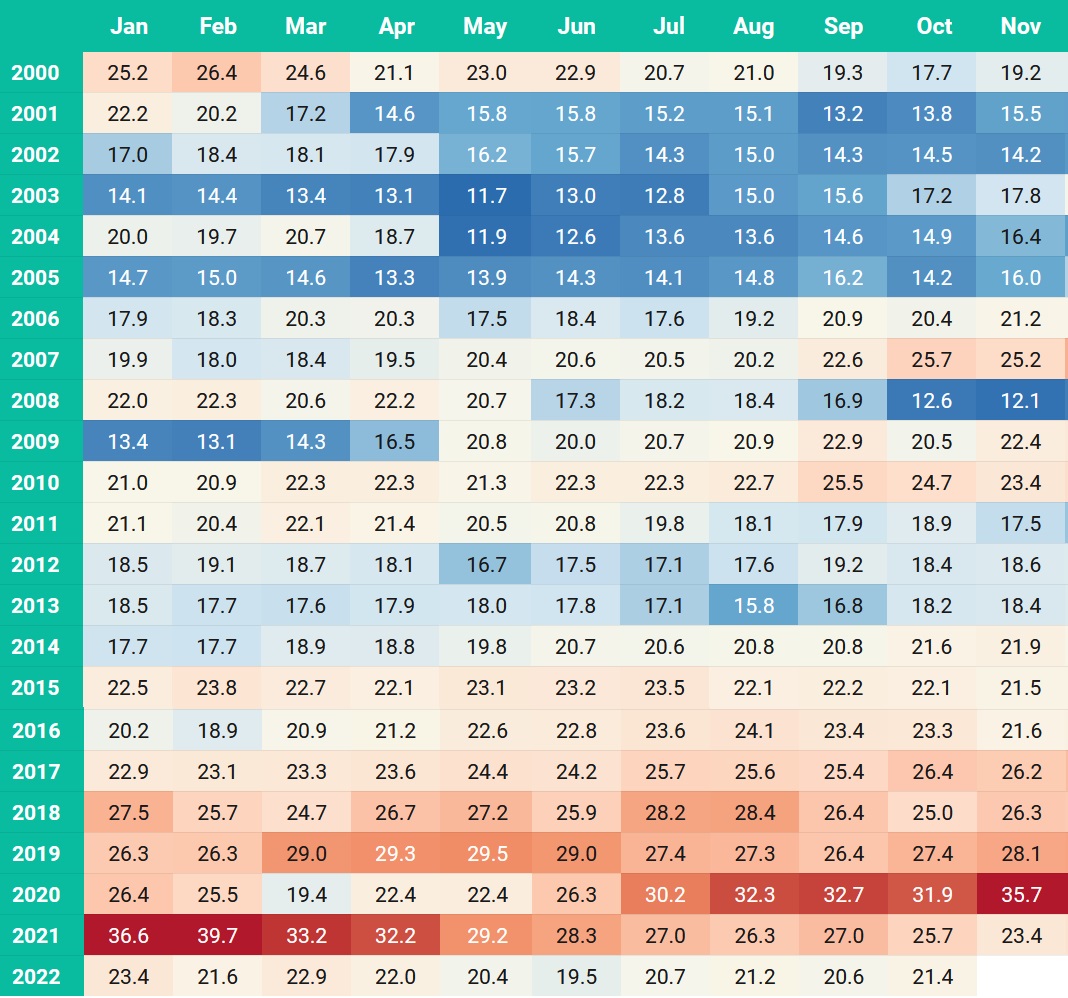
Note: Data source is Nseindia website. Chart shows average historical NIFTY Price-Earnings ratio for the month from 1999 to Nov 2022